Graphic Inquiry:
Dynamic Differentiation and Digital Age Learning
 Learn to differentiate with technology-enhanced graphic tools and resources.
Build authentic learning environments through object- and place-based inquiries. Illuminate projects and nurture digital citizens.
Want to make a QR Code? Go to QR Code Generator. Also try a URL shortener.
On this page, we'll explore ways to combine content from various subject areas such as language arts, science, social studies, and math with information and technology skills and strategies to meet diverse learning needs and address Standards for the 21st Century Learner.
Explore the following areas of this page:
- Dynamic Differentiation
- Differentiate with Graphics
- Learning through Graphic Inquiry
- Graphic Inquiry and Digital Age Learning
Dynamic Differentiation
Each child is unique. Use technology to address these differences! Work as an educational team to focus on the needs of subgroups in the classroom. Collaborate on the development of learning experiences that address student readiness, personal interests, and engaging choices.
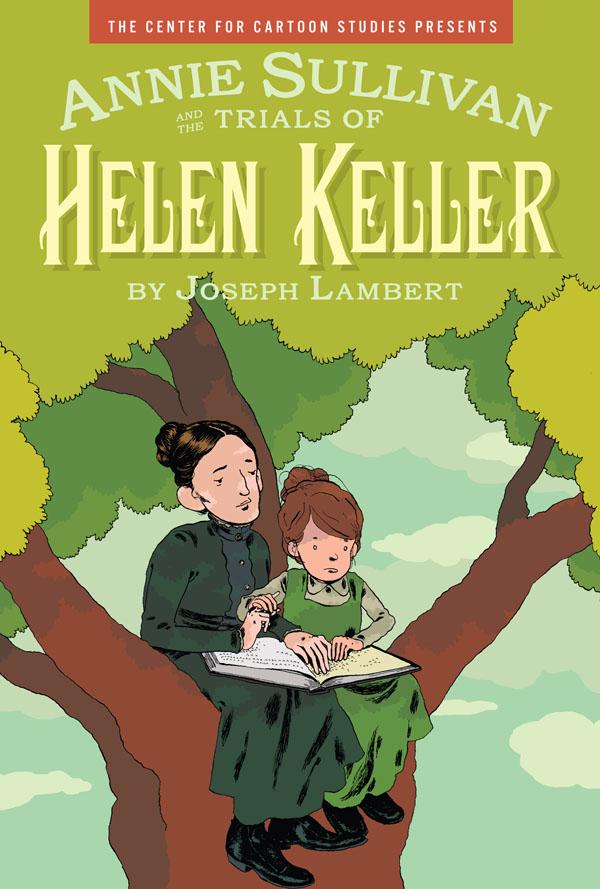
Young people often focus on a Google Everything Search and miss out on great resources. Let's say you've been reading a book about Helen Keller called Annie Sullivan and the Trials of Helen Keller by Joseph Lambert. Use the many Google search options to explore this topic by simply searching for Helen Keller using different Google options.
Use Google Images to search for images. Try dragging an image into the search area. Drag the photo below into Google Images. Is this Helen Keller?
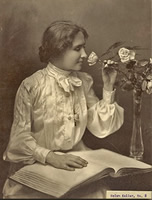
 Try It! 1: Google Images
How could you use this in teaching and learning? Let's try out some ideas. Break up into small groups. Each member should use Google Images to answer their question.
What information skills or content-area standards could you address using this type of assignment?
1. The Woman. I found an old photo that looks like Annie Sullivan from the graphic biography. Is it really Annie Sullivan or another famous woman? How will I know for sure?
2. The Currency. I opened the book sent to me by my mysterious friend. Out slipped this currency. Am I rich?

3. The Insect. At first it looked like an ordinary mosquito. Then, I looked again. Is this like the mosquitos I always see in the backyard? Or, it an invasive species? Should I be worried?

4. The Artwork. I saw a Saturday Night Live skit where they re-enacted this painting, but I don't know anything about it. What's it called? When was it painted? Who painted it and why do those people look so strange?

Differentiated instruction was first identified by Carol Ann Tomlinson in the 1990s as a way to provide different avenues for students to construct knowledge. Consider ways to combine traditional resources with 21st century technologies to meet the needs of all students.
An Example
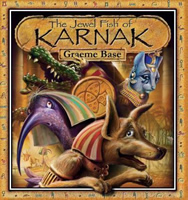 Let's use the book The Jewel Fish of Karnack by Graeme Base as an example. Watch the video to learn more about the author, book, and game. Read the book. Then, go to the website to solve the puzzle. Use KeepVid to download the video for use with a class. Consider the many ways that this book could be used to jumpstart learning.
First, think about how the book mixes nonfiction with a fictional story. For instance, read the inside of The Jewel Fish of Karnak book cover for background information about the facts related to the story set in Ancient Egypt.
How could you connect other works of fiction with factual information and content area standards?
Second, look for visual elements, codes, games, and other elements that will bring content area learning alive. For instance, The Jewel Fish of Karnak includes history-based characters, hieroglyphics, and other interesting elements.
What other picture books have interesting visual elements that could expand interest?
Third, use the author's website materials including videos, games, mysteries, and other elements to bring reading alive. For instance, Graeme Base's website contains a video that introduces the book and challenges, a game area, and other interesting information.
What authors have great resources you can use to expand a reading experience?
The Problem... Most books don't have great nonfiction resources and fun games.
The Solution... Build your own!
To find great resources, do a Google search for your topic and add the word "pathfinder" to see what other librarians and classroom teachers have created such as Ancient Egypt.
There are many great books set in Ancient Egypt such as:
- Bill and Pete Go Down the Nile by Tomie dePaola
- Cleopatra VII: Daughter of the Nile by Kristiana Gregory
- Egyptian Cinderella by Shirley Climo
- I am the Mummy Nefert by Eve Bunting
- Mrs. Frizzle's Adventures in Ancient Egypt by Joanna Cole
- Mummies in the Morning by Mary Pope Osborne
- Muti's Necklace by Louise Hawes
- Pepi and the Secret Names by Jill Paton Walsh
- Sphinx's Princess by Esther Friesner
- The 5000 Year Old Puzzle by Claudia Logan
- The Time Warp Trio: Tut, Tut by Jon Scieszka
- We're Sailing Down the Nile by Laurie Krebs and Anne Wilson
Brainstorm visuals that inspire creative questioning. How can you encourage deep questioning rather than surface level questions? Use resources like Wikimedia Commons to locate images.
Much of The Magic and the Mummy by Terry Deary can be read at Google Books. Use these previews to generate interest.
Infuse quality, nonfiction resources associated with the work of fiction:
- BBC
- British Museum
- Canadian Museum of Civilization
- Egyptian Mythology
- Eternal Egypt
- Great Scott
- Mr. Donn's Ancient Egypt
- National Gallery of Art
- National Geographic
- Hieroglyphs
- Museum of Science
- Neferchichi's Tomb
- Odyssey Online
- PBS, PBS, PBS, NOVA
- Royal Ontario Museum
- Scholastic
- Smithsonian Journey
- Tour Egypt
 Integrate graphic and interactive elements:
- Go to NOVA to do a 360-exploration virtual trip.
- Go to Discovery to Build a Pyramid.
- Locate charts, timelines, and maps at the Royal Ontario Museum.
- Try the hieroglyphic typewriter, hieroglyphs translator, or make your own cartouche.
- Try iPad apps like Egypt Engineering.
- Explore student projects.
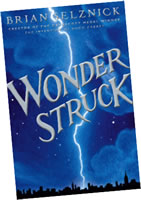
Select a visually rich book and consider the many ways it could be used.
For instance, Wonderstruck by Brian Selznick tells two stories: one visual and one text. Google Books has a nice preview to give you the sense of the book.
Also, think about the nonfiction resources that could accompany the book such as ASL (American Sign Language) and the American Museum of Natural History, Museum of Jurassic Technology resources.
For more ideas, check out the Wonderstruck Pathfinder.
Let's explore three ideas for identifying resources.
- Creator Information. Use YouTube to search for author interviews. Do a search for a book title and author interview or the author's name and interview. For instance, check out an interview with Suzanne Collins author of The Hunger Games. Then, examine the Scholastic Teens channel. For instance, you can find a video of by Lois Lowry talking about writing.
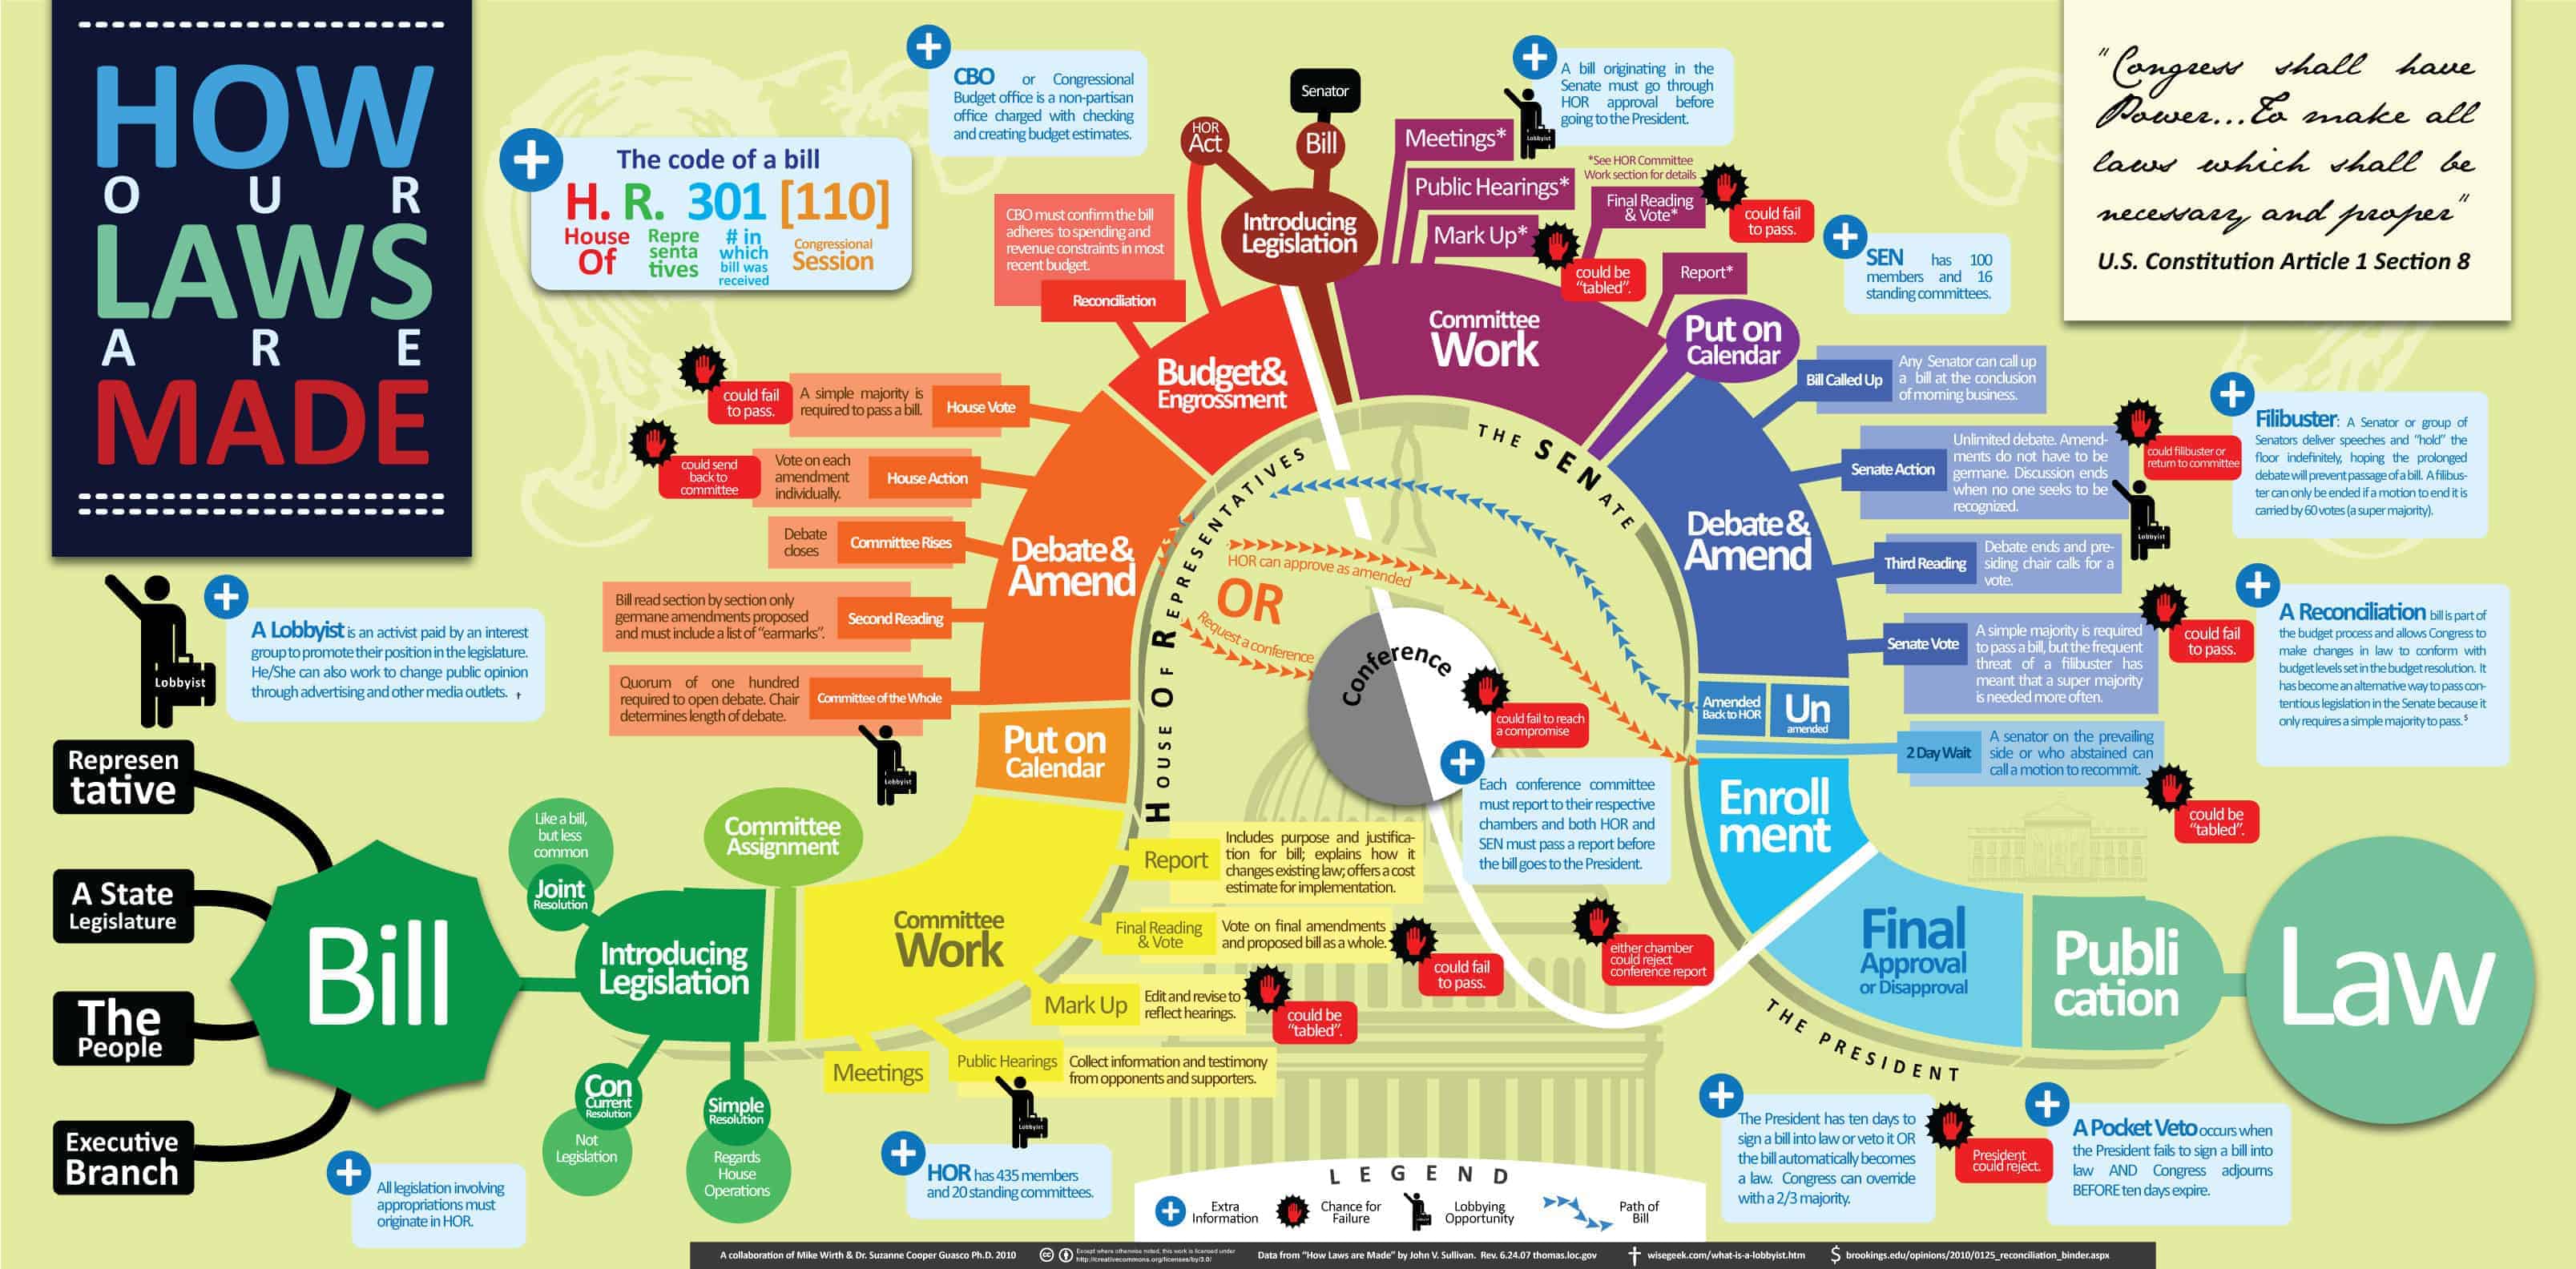
- Organize Information. Use Google Images to locate specific types of visuals such as insect life cycle, World War II timeline, human eye diagram, climate change concept map, leaf identification key or how laws are made infographic. For instance, you can find graphics organizers about the Giver.
- Visualize Information. Use Cities360, Panoramio, GigaPan, and others to identify virtual field trips to places like habitats of Africa or Machu Picchu. For instance, you can imagine the setting for part 4 of the Giver series, Son. Examine the Sistine Chapel. Check out the New 7 Wonders and View Your World. Think about a tour you could build.
Try It 2! Readiness, Interests, & Choice
How can graphics help us address each of the three areas of differentiation: readiness, interests, and choices? Brainstorm ideas in each area.
Then, look for visual resources to bring learning alive.
Search YouTube for author interviews. Or, try Reading Rockets or Barnes and Noble.
Search Google Images for topics and add the life cycle, timeline, diagram, concept map, identification key or infographic. What other visual terms could you use?
Search Cities360, Panoramio, GigaPan for locations that could be used to understand particular locations and the social studies and science connected with these placed.
Differentiate with Graphics
 Think about the inquiry process. Consider ways that graphics could be woven throughout the inquiry process to held students learn.
- Questioning
- Exploring
- Assimilating
- Inferring
- Reflecting
Match content-area and 21st century standards with the types of graphics that young people may use as part of an inquiry. Consider activities that address individual differences, readiness, interests, and choice.
Some students are successful with a lecture and a textbook. While others need practice, a chance to explore a range of resources, and varied experiences.
 Think about ways to transform the exploration of acid rain, the water cycle, and the environment through the use of graphics.
- A learner who has difficulty with a traditional written science log assignment may be more successful photographing the process.
- A learner may use a map to better understand the relationship between weather patterns and acid rain.
- A learner may use historical photos to see how smoke and acid rain impact cars.
- A Venn diagram may be used to compare sources of pollution in two counties.
- A timeline may document changes in air quality regulation over time.
Let's explore six types of graphics that work well for differentiation: illustration, data sets, infographics, maps, organizers, and photos.
Data
Data is a collection of facts that are the result of observation, experience, or experiments. Students can use charts and graphics to better understand data and convey their own work.
Student enjoy timely information that connects with their life. Involve students in using information from the 2010 US Census in their inquiries. Start with national data, then ask them to look at state and local trends.
Go to Public Data Explorer.
Use existing data to create a chart, graph, or map.
- BetterWorldFlux.
- Data360.
- DebateGraphic.
- Gapminder.
- Regional Explorer.
- World Bank Data.
- Worldmapper.
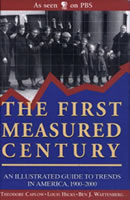 In The First Measured Century from PBS, data are used to show trends from 1900-2000.
You can download the book at PBS as a PDF, read much of the book on Google Books, and also explore the PBS website for text, graphics, and video.
Involve students in analyzing existing data sources and collecting their own data. For instance, students might compare the chart found at USA Today Snapshots with an inventory of the food in their own home. The online tool Create a Graph works well for students creating their own graphs.
Keep it simple. Read Right Outside My Window by Mary Ann Hoberman. Create a predicted and actual temperature chart. Involve students in taking photographs of the different seasons.
Involve high school students in creating their own online polls using tools such as Zoho Polls, Flisti, and Survey Monkey.
Many interactives can help students collect data for their own projects. Read the Science of Cycling. Go to the Free Ride interactive. Go to Iluminations for ideas.
Explore tools for creating your own charts and graphs:
- Create a Graph
- Alternatives
- ChartGo
- ChartTool
- ChartTool from Google
- Cool Graphing. Great for elementary.
- Graph Master. Great for Elementary.
- Pie Creator
Try It 3! Data Sets
What's an area other than math where data could be examined, evaluated, and applied?
Brainstorm data sets and topics.
Illustration
Challenge student thinking by presenting young people with unusual images. For instance, many students have seen Civil War photographs, but have they seen drawings? Use visual variety to enrich the learning experience.
Involve students in analyzing illustrations.Explore WPA posters. Ask questions such as:
- Who created it?
- What's the purpose?
- What's the intended audience?
- Was the image created from first-hand experience?
- Is it truthful?
- Is it posed?
- Is it biased?
- Is it time specific?
Comics and illustrated books are being produced by many groups:
- Federal Agencies: On the Trail of the Missing Ozone, Ready Kids
- Non-profits: Bound by Law?
- Journals: Nature's Adventures in Synthetic Biology
- Websites: HowToons
- Teaching Materials: Too Smart too Start
Show students Public Service Announcement Comics and have them make their own:
- PSA Comic: Bat Bites
- Online Comic Makers: MakeBeliefsComix, Pixton - Fire Safety, ToonDoo - Bullying Comics
- Comics Software: Comic Life

Connect graphic histories with practical visual products.
- Read Journey to Mohawk Country. Compare the original journals to the graphic history.
- Explore student projects at Kids Illustrate blog.
- Involve students in creating their own graphic history.
Explore tools for creating your own diagrams and illustration:
- Pixton. Use the free version or consider the school version. Check out the Digital Citizen example.
- Alternatives
- Bitstrips. Need to sign-in to save.
- Bubblr
- Cartoonist from Creaza
- Chogger
- Comic Creator
- Comic Master
- Comic Strip Maker. Easy for younger students.
- Comix
- Lego City. Great for younger students.
- KABAM. Restricted to the story and theme provided.
- MakeBeliefs Comix. You can print or email your comic. No storage.
- Myths and Legends
- Professor Garfield. Provides characters for stories.
- Scholastic
- Bone Comic Creator.
- Captain Underpants
- Charlotte's Web Comic Creator. Easy for younger students.
- Smile Comic Creator
- Strip Generator. Sign-in required to save and publish. Print without sign-in.
- Superhero Squad Show
- Superlame
- ToonDoo
- Toonlet
- Witty Comics
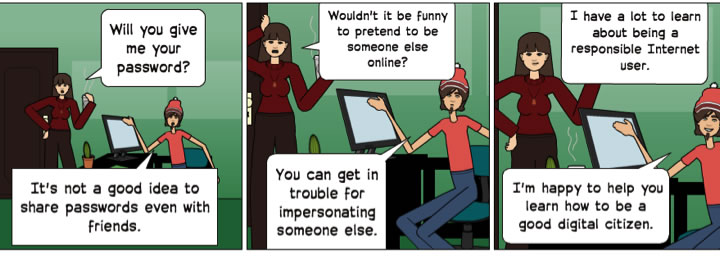
NETS-S 5d. exhibit leadership for digital citizenship.
Ask students to create a comic on the topic of digital citizenship dealing with an important teen issue such as texting and driving, privacy, use of passwords, social networks, copyright, etc.
Try It 4! Illustration
Have you tried graphic novels and comic creation in the classroom? If so, share your ideas.
If not, brainstorm the possibilities. Or, try out a comic tool.
Infographics
Infographics has become a popular way to visually represent many forms of information. Students develop and apply evaluation skills when they analyze infographics such as The Tongue.
An infographic is a graphic representation of information. It provides the "big picture" that might otherwise be difficult to understand by using visuals to quickly convey the key ideas.
Learn to make an infographic with an infographic, learn about why infographics are important student projects, and learn about design of infographics and creating your own.
Ask students to look at the history of slavery in a different way using 389yearsago or examine Burning Fuel as a visual analogy.
Explore different types of infographics, then create your own:
- Explore Top 100 SciFi and Fantasy Books. Create your own infographic of favorite books.
- Explore A Disaster for FEMA. Learn more about one of these types of disasters.
- Explore How Dangerous is Your House? Do your own study.
Let's say students are going to examine the way information is organized on an infographic. If you let students search on Google, they'll enjoy the exploration, but it may not be the best use of their time. Teach students to search for specific types of information in specific formats such as climate change infographic and you'll find an interesting comparison of global warming skeptics vs scientific consensus. However, the activity may be more effective if you pre-select resources focused on a content area such as A Visual History of the American Presidency or Unlocking the Mystery of the Humpback Whale. Otherwise you'll find a group of students checking out Beer Pong.
Show students the Smore infographic and ask them to create their own rather than writing a paragraph of step-by-step instruction.
Go to Titanic with the Costa Concordia. This infographic is in Portuguese. How much can your Spanish students interpret?
The Learning Network at the New York Times did a nice series on teaching with Infographics:
- Teaching with Infographics: Places to Start
- Teaching with Infographics: Social Studies
- Teaching with Infographics: English
- Teaching with Infographics: Science and Health
- Data Visualized
Explore lots of examples:
- Cool InfoGraphics
- Data Visualization
- Flowing Data
- Gapminder
- Good
- Good Transparency
- Hipmunk Flight Search
- Infographics Showcase
- Joe Lertola
- NMap
- USA Today Snapshots
- Visual Economics
- Visualizing.org
Learn more about using infographic as a creative assessment at Kathy Schock's page.
Ideas for creating infographics:
- Collect and organize information
- Write a descriptive title
- Identify the key ideas
- Put data in a context through a theme, comparisons, or other scheme.
- Visualize data using graphic organizers, charts, tables, etc.
- Think about how you will visualize different types of information
- Maps - locations
- Numbers - charts and graphics, picture charts
- Time - timelines, line chart
- Text - concept map
Try some infographic apps for your iPad. Learn more at 10 Infographics and Visualization Apps for iOS.
You already have the tools to create infographics. The key is combining these in useful ways.
- Microsoft SmartArt - it's in Word, PowerPoint, etc.
- Microsoft Powerpoint - You can set the page to any size, then add your elements.
- Create a Graphic - easy to use web tools
- Bubbl.us - online tool for concept maps
- Many Eyes
Try It 5! Infographics
What tools could be used to create infographics?
Brainstorm the possibilities.
Or, explore sample infographics
Maps
Maps are a powerful way to meet the visual needs of young people. They can help students identify locations, routes, and patterns. This type of visual thinking can be very helpful across the curriculum:
- Explore the Cancer Mortality Maps and speculate on why some areas have more of a particular type of cancer. Ask students to locate evidence to support their claim.
- Explore HowBigReally. Use it to help students visualize sizes in the world. Use Google Maps to create your own.
- Go to Novelsonlocation. The pins represent books that take place at those locations. This type of activity could be done with books in a particular state, books about a time period such as World War II, or other topics. Google Mapsis used for this project.
- Go to Google LitTrips to extend the idea to include trips associated with books.
- Explore A Literary Map of Manhattan. Could you make one for your state, city, or country? Get students involved with creating their own maps using Google Maps.
- Think about activities that involve students in analyzng and creating maps. Explore other maps: CDC Flu Map, Environmental Disasters, Tracking the Oil Spill, Water Maps
- Example the Lyme Disease Map. Make prediction using evidence to support the prediction.
- Use the US Government Map Master List for many more map examples.
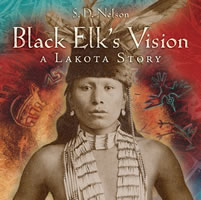 Encourage students to learn more about the settings of any book they are reading. Now and in the future. Model the idea of expanding the learning experience through the use of maps and other visuals. When reading a book like Black Elk's Vision by S.D. Nelson, show the timeline in the book. Find the locations on the map. Talk about the distances.
Use historical maps to analyze a particular place such as Manhattan. Ask students to:
- Identify place
- Identify change
- Make predictions
- Ask big questions
Ask students to analyze the past, create the present, and make comparisons.
Explore a class project called Mapping the World by Heart. They used the Mapping the World by Heart materials as the basis for their project.
Explore tools for creating your own maps:
- Google Mapmaker
- MyGreatMaps and MapMaker 2.0. Perfect for elementary and middle schools.
- National Geographic MapMaker Interactive
- National Altas Mapmaker
- Old World Map Maker. Great for elementary school. Create an "old world" map.
Try It 6! Maps
Brainstorm ideas for using Google Maps.
If you haven't looked at the CREATE maps feature, explore this option.
Organizers
Organizers help young people think about the content they are exploring. Use organizers as an alternative to traditional writing activities. After reading First the Egg by Laura Vaccaro Seeger, ask students to create a process organizer showing the entire process for one of the examples in the book. Use organizers as a guide for writing. Some students have a hard time getting started. Ask them to make a likes and dislikes chart for preplanning. While reading The Calder Game by Blue Balliett students reflected on photographs of sculptures.
In the article Guiding Students with Eight Types of Graphic Organizers, Gallavan and Kottler describe how organizers can be used to share knowledge. These can be applied to the study of animals using book such as Nic Bishop's Marsupials. As students conduct inquiries, they can share their understandings in the following categories:
- Assume and Anticipate
- Position and Pattern
- Group and Organize
- Evaluate and Estimate
- Compare and Contrast
- Relate and Reason
- Identify and Imagine
Organizers are a great way for students to think about key ideas before they begin a writing project. It's also a great way to discourage plagiarism.
Create your own using the SmartArt in Microsoft Word or PowerPoint. Use Exploratree for organizer starters. Or, use an online tool for creating your own from scratch.
Explore tools for creating your own graphic organizers:
- Bubbl.us. Very easy to use. Try it without signing up. No distracting tools, choices, or options.
- Alternatives
- Cacoo. Create diagrams and concept maps.
- Creately. Create diagrams and mindmaps. Try it without signing up.
- Diagrammr. Very easy to show relationships. Try it without signing up.
- Diagramly.
- DropMind. Create mindmaps. Must sign up.
- Gliffy. Works great, but very annoying signup reminders. Try it without signing up.
- Lovelycharts. Create charts. Must sign up.
- Lucidchart. Create a flowchart or concept map. Try it without signing up.
- Mindmeister. Create a concept map. Must signup.
- Mindomo. Create a mindmap. Must signup. Three maps for free.
- mind42. Create mindmaps with links. Must signup.
- Popplet. Creat concept maps and post-its. Must signup.
- Slatebox. Creat mindmaps. Must signup.
- Spicynodes. More an a mindmap. Includes lots of space for text, links, images, etc. Try it without signing up.
- SpiderScribe. Create maps and include notes, documents, images, etc.
- Text2Mindmap.
- Venn from ReadWriteThink
Try It 7! Organizers
Brainstorm activities that go beyond "make a concept map".
Photos
With easy access to digital cameras, think about ways to differentiate with photography.
Involve students in photographing both the process and products involved in projects.
Read Diary of a Worm by Doreen Cronin. Use a digital camera to photograph a composting project.
Teach young people to critically analyze photographs. For instance, Edward S. Curtis's photos of Native American people are well-known. Are they stereotypes? Are they posed? Does this make a difference? Do they reflect the times they were taken?
Ask students to think about the use of photo editing tools. How does cropping an image impact the message?
In his book How to Interpret Visual Resources, Harry Stein stresses four ideas when examining images:
- First impressions
- Feelings
- Connecting to personal experiences
- Last impressions: revisiting an image
Use DocsTeach from Library of Congress to help students analyze and work with images as visual evidence.
Ask students to analyze an image that representing a position opposed to their own thinking (see example below left).
In many cases, it's a good idea to create a model so students can see the expectations. This was done with the comic based on the book What Would You Do with a Tail Like This? by Steve Jenkins (see example below center).
Ask students to incorporate historical images into their projects. For instance, young people were asked to create a public service announcements applying historical images to a current issue. In this case, the student applied images related to the Civil Rights Movement to the Gay Marriage Issue (see example below right).


Ken Burns, the Dust Bowl is a great example of how historical images bring a time period to life.
Use websites such as PicLits and Life Photo Archive to engage students in writing about photos.
Many sources of image banks are available such as Kitzu that can get you started creating your own collections of images for classroom use.
Focus on government image websites to stimulate questioning. You can find many photo collections at FirstGov. The US Government also have a Flickr page. Show photos of working dogs from the border patrol. Why is the dog sniffing grandpa's bag? What are your questions about working animals?
You can also check out image galleries by state. For instance, you might use the State of Oregon images page to show students photos from Oregon farms. Ask students to write questions based on the images.
US Government Resources
- Agriculture Research Service
- Cancer Institute
- CDC Images
- Department of Defense
- EPA Image Gallery
- FEMA
- Fish and Wildlife Photos
- Library of Congress
- NOAA Photo Library - science
- NASA Images
- NIH
- NREL
- USGS Images
- Smithsonian Collections
- Smithsonian Wild
- US Park Service
- US Government Resources - Best Photos
Global Government Resources
Use websites that provide public domain or open use images:
Explore sources for images students can use:
Start at Flickr Creative Commons and Wikimedia Commons. Check out the National Archives collections page.
Check Flickr the Commons for large-scale imaging projects from museums and libraries.
Look for visual kits at KitZu for free visual ideas.
- General Photos
- CalPhotos
- Compfight. General search tool.
- Creative Commons. Searches popular sites for open materials.
- Edupic. Great photos categorized by subject area for teachers.
- Europeana. Searches Europe's cutural collections
- Fotopedia. Search the open area.
- Free Images
- Free Stock Photos
- Images of the World
- NeoK12. Great images by subject area.
- Life. Magazine photos.
- PD Photo
- Pics4Learning - designed for students and teachers
- Clipart
- Clker
- DK Clipart
- OpenClipart. The best place for clipart.
Thinglink is an easy-to-use tool that allows users to create notes and hotlinks on images. It's a great way to critique paintings, reflect on history, or create a visual map. Very easy to sign up and use. You can upload 10 images for free.
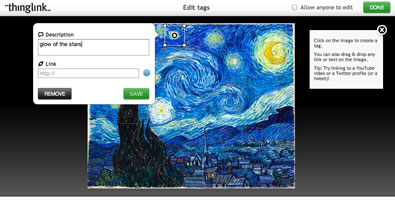
Try Thinglink. For ideas, go to 15 Incredible Historical Photos, 13 Photos that Changed the World, 30 Photos that Changed the World, and World's Famous Photos.
Also, try a similar tool, Speaking Image.
Try It 8! Photos
Examine photos. What do you see in the photo that we could highlight and describe? Develop public domain and copyleft photosets for key topics.
Explore the websites provided to get started.
Learning through Graphic Inquiry
Graphic inquiry involves weaving visual representations throughout the inquiry process.
 Infuse graphic representations into text-heavy lessons such as the poetry of Walt Whitman. Use the picture book along with historical photos from Library of Congress.
Differentiate throughout the learning experience:
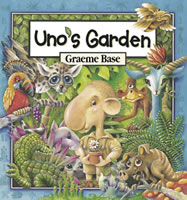
- Content. Students might have many books to choose from with different ways of approaching the content and different reading levels such as Uno's Garden by Grame Base and The Evolution of Calpurnia Tate by Jacqueline Kelly.
- Process. Students may have choices in the topics they select as they are exploring the resources at e-nature.
- Product. Students might write paragraphs, but they might also create a map, chart, graph, or scrapbook of their results.
Let's explore three types of learning that work well with differentiation and digital age projects.
Object-based Learning
Artifacts and objects can serve as inspiration for exciting, inquiry-based learning experiences. Objects are living and nonliving natural objects such as shells.
Ask students to explore interesting objects. The book Object-Based Learning Using Everyday Objects by Amy Edmonds Alvarado has lots of ideas for object-based learning.
Rather than a final product, consider an incomplete object such as "what did Abraham Lincoln's statue look like before it was completed?"
Incorporate digital cameras into object-based products along with classic books such as The Fall of Freddie the Leaf by Leo Buscaglia.
Involve students in taking photographs of their dioramas and other projects. Or, create diagrams for their projects.
Read Measuring Penny by Loreen Leedy. If you want to incorporate objects you don't have, use Pective for the sizes.
Use museum websites for locating online artifacts that go with history projects. Go to Smithsonian's History Explorer: Museum Artifacts and Within These Walls.
Place-based Learning
Place-based learning connects students with the local community by grounding experiences in local phenomena. For instance, after exploring The Freedom Trail in Boston, they might create their own using Google Maps.
Create ongoing activities that involve students in learning about local history such as the Montana Heritage Project.
Explore local issues such as Coal Mining and ask students to use tools such as Animoto to create their own communications.
Think about how the school library can support these types of activities by checking out kits that contain GPS devices, digital cameras, clipboards, testing equipment, and other mateirals.
 NERDS by Michael Buckley contains GPS coordinates at the beginning of each chapter. The N.E.R.D.S. book series is a great way to connect reading with a sense of place. Check out the NERDS Teacher's Guide. Get students involved in creating maps to go with their own stories. They may be stories written about your local area with familiar locations. Or, students can write about places they are learning about in class.
Read The Genius Files by Dan Gutman at Google Books (the first couple chapters are online). Take a cross country RV trip with the characters. The introduction to the book provides a challenge to readers, "To the Reader... All the places mentioned in this book are real. You can visit them. You should visit them!" The first chapter describes a schools and mountain. You can find these on Google Maps. The next chapter says "Coke had been intrigued enough to do a Google search of wingsuit BASE jumping. Go ahead and look it up..." When you look it up, you find video and images of jumpers! As they travel they visit fun places like the "Largest Ball of Twine" in Cawker City, Kansas.
 Think about ways to bring the house where Anne Frank lived to life.
- Anne Frank - YouTube Channel (Use Zamzar to download clips)
- Anne Frank - Official Website
- The Secret Annex - Virtual Exploration
- Anne Frank: The Anne Frank House Authorized Graphic Biography by Sid Jacobson and Ernie Colon
- PBS Masterpiece Theatre
Project-based Learning
Graphic elements can be incorporated into many types of student projects.
 Students exploring celebrations might start by creating a graphic organizer in Bubbl, download photos of current and historical events, and create a wall mural as a group.
Use visual tools to help students visualize the characters, setting, and plots of a story. Use technology to create a fiction or nonfictions story. Involve students in experiences that help them explore stories, relationships, and patterns. How can we make the virtual world more tangible? What types of "tangible souvenirs" might be possible?
Many online tools can be used for creating projects and communications. Generator tools help users create interesting products with little effort.
Elementary
For each of the following activities, students build, save the image, and insert into a word processor. Then, write a story, create a problem to solve, or create directions. Design activities that ask one child to work from the creation of another student.
- Build a House. Write about who lives in the house.
- Build a Car. Write about a trip in the car.
- Color, Draw, and Paint
- Make a Christmas Tree. Write a story about a lonely Christmas tree.
- Make an Easter Egg. Design an egg for someone special. Write about who gets the special egg.
- Make a Face. Create two characters. Save each. Write a conversation.
- Make a Gingerbread House. Describe what it would be like to live in a Gingerbread house.
- Make a Pizza. Write the directions for making the pizza. Or, figure out the cost of making the pizza.
- Make a Pumpkin. Write a story about a pumpkin that comes alive.
- Make a Robot. Create a robot. Describe the elements and design to a classmate. Figure out the cost of making the robot.
- Make a Snowman. Create a snowman based on a description from a card. Can you match the snowman to the card?
Middle/High School
- Redkid - Sign Generators
- Fake Newspaper. Create a fake newspaper for your story.
- Packland. Create cool looking comic backpacks to include in storytelling.
- Trading Cards
- Warning Label Generator
- HugeBigLabs - create lots of fun visual images with photos like magazine covers and movie posters.
- Movie Clapper Board Generator - Creates a movie clapper image.
- Newspaper Generator - Creates a newspaper front page.
- Shelter-Ecards - Create a video newspaper e-card.
- Imaging
- Use FotoFlexer to post your game points.
- Image Generators
- HugeBigLabs - create lots of fun visual images with photos like magazine covers and movie posters.
- Movie Clapper Board Generator - Creates a movie clapper image.
- Newspaper Generator - Creates a newspaper front page.
- Redkid - Sign Generators
- TiltShift - Turns a photo into what looks like a miniature world.
- ClassTools
- Chopper Builder
- Fake iText
- Fake receipt generator
- Randomly Generated Identity
- Typo-Generators - creates text from photos
ReadWriteThink Generators
ReadWriteThink Generators
- Book Cover Creator
- CD Cover Creator
- Comic Creator
- Cube Creator
- Letter Generator
- Persuasion Map
- Acrostic Poems, Shape Poem
- Postcard Creator
Students help to solve the mystery of unfinished stories using pictures from The Mysteries of Harris Burdick. Check out a blog where students shared their results.
Help your teachers find ways to differentiate through the use of visual elements. Use books like A Bee in a Cathedral and 99 Other Scientific Analogies by Joel Levy to model and stimulate creative thinking.
 Keep your eye out for new online tools for creating infographics and other interesting ways to share understandings. Visual.ly is still in the development phase, but it has lots of potential.
Redesign assignments and assessments:
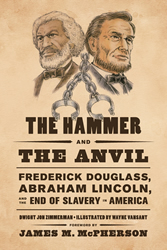
- Read engaging works of nonfiction such as the wonderful graphic history The Hammer and the Anvil by Dwight Jon Zimmerman.
- Ask students to judge the accuracy by verifying and expanding the information foundin the work.
- Do the visuals convey accurate representations? Compare visuals to historical photos.
- Ask students to use primary sources to defend their arguments.
- Then, create your own comparison. How as BLANK like/unlike BLANK?
Promote audio projects using existing tools like PowerPoint, but also online tools like Voki. Explore elementary Voki projects.
Try It 9! A New Connection
Reflect on the possibilities for object, place, and project-based approaches.
Choose 1 new resource, tool, or idea you want to explore.
Graphic Inquiry and Digital Age Learning
 When we combine graphics elements and engaging environments with inquiry-based learning, we have an exciting environment for digital age learning.
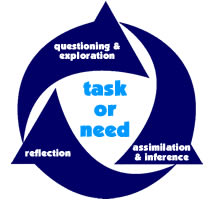
Annette Lamb (1997) developed a model called the 8Ws using everyday terms to describe the inquiry process. The Ws are explained below within the context of Callison's components of information inquiry.
Daniel Callison (2002) identified five components of information inquiry: questioning and exploration, assimilation and inference, and reflection. Callison states that inquiry can address a workplace or professional problem, academic information task assigned by a teacher, or personal information need. When these three areas overlap, authentic learning can occur. There are many other models such as Big6 that also explore information searching.
Let's explore one example.
Questioning and Exploring
The inquiry process begins with an open mind that observes the world and ponders the possibilities.
Watching asks inquirers to become observers of their environment becoming in tune with the world around them from family needs to global concerns. Encourage young people to read the new at USA Today, CNN, CBC, BBC, Reuters, PBS, and other news outlets.
I read part of the book Our Choice by Al Gore. I got the new iPad app. It made me think about our oceans. I watched the award winning documentary A Sea Change. I was shocked and wanted to learn more about whether the future might be "a world without fish." Is ocean acidification really going to kill all the fish?
Wondering focuses on brainstorming options, discussing ideas, identifying problems, and developing questions.


I watched Mark Kurlansky talk about his new book World Without Fish on YouTube. I used Zamzar (SaveYouTube) to download clips to share in class. I also shared the comic series. I also checked out The Last Fish Tale, the Big Oyster, and Cod by Mark Kurlansky to explore more about the history of fish.
Exploration involves observing the world, investigating possibilities, collecting resources, interviewing experts, and experimenting with ideas.
Webbing involves students in identifying and connecting ideas and information. Data is located and relevant resources are organized into meaningful clusters. One piece of information may lead to new questions and areas of interest.
After examining infographics: Earth's CO2, Fish Stocking and Which Fish to Eat I have a lot more questions about marine life. I wondered how scientists collect information to determine the impact of things like oil disasters, overfishing, ocean acidification, pollution, and climate change. I've been exploring information about Climate Change and Marine Life through Google Earth. Experiences such as Prince William's Oily Mess: A Tale of Recovery - Graphic Changes in Marine Life: Working with Real Data provided real-world applications of science.
Exploring leads back to questioning. Questions may be refined, restated, or new queries may emerge.
Assimilating and Inferring
Assimilation involves processing, associating, and integrating new ideas with already available knowledge in the human mind. This can be the toughest phase for young people because they may be uncertain about what they've found and where they're going.
Wiggling involves evaluating content, along with twisting and turning information looking for clues, ideas, and perspectives.
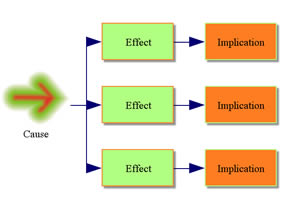
Inspiration templates are useful in organizing information. Inspiration provides two templates that focus on causality and cause/effect that would be useful for this type of thinking.
Marine life is changing. However what is the root cause? Is it overfishing, pollution, ocean acidification, climate change or a combination? What is the impact of each element? How do they impact each other? What must be done?

Next, young people apply evidence to solve problems and make decisions.
Weaving consists of organizing ideas, creating models, and formulating plans. It focuses on the application, analysis, and synthesis of information.
I've been thinking about all the organizations that support marine life. Each of these groups has a different perspective on marine life issues, causes, and solutions. I analyzed the text and photographs on their page. I created a diagram to show how their approaches were alike and different.
- Blue Ocean
- Cousteau Society & Cousteau Kids
- Environmental Defense Fund
- Greenpeace
- Marine Stewardship Council
- Monterey Bay Aquarium
- National Resource Defense Council
- The Nature Conservancy
- Ocean Alliance
- Oceana
- The Whaleman Foundation
As students weigh evidence, they may go back and collect additional information to support their inferences. This process of assimilation and inference reoccurs as young people accumulate information.
Reflection
As students make decisions and solve problems, they think about the process and consider how to share their conclusions and plan for future inquiries.
Wrapping involves creating and packaging ideas and solutions. Why is this important? Who needs to know about it? How can I effectively convey my ideas?
I think teens need to know how to take action and make good decisions about fishing and eating seafood. I created a Glogster poster showing the features of the organization I support and why. I really like the work of the Marine Stewardship Council because they focus on sustainable seafood.
Waving consists of communicating ideas to others through presenting, publishing, and sharing. How will I market my ideas and who will I ask for feedback?
As I read about sustainable fishing and looked at the many photos and diagrams, I realized the importance of sustainable fishing practices. I used Comic Life to create a graphic book about both personal and professional fishing practices. This format is attractive to teens.


Wishing involves assessing, evaluating, and reflecting on the process and product of inquiry. Was the project a success? What will I do next?
I created a YouTube search story as a reflection of my experience searching for information about "a world without fish." Watch the result.
After learning about the all the issues, I began another round of inquiry. I downloaded the Seafood Watch App for iPhone and Android and used the Project Fishmap for iPhone and Android to find local places with sustainable seafood products. I'm going to interview some local restaurant owners about their buying practices.
Try It 10! Graphic Inquiry
Think about how you'll weave graphics throughout the inquiry process including questioning, exploring, assimiliating, inferring, and reflecting.