Inquiry Starters
"Mathematics is not about numbers, but about life. It is about the world in which we live. It is about ideas. And far from being dull and sterile, as it is so often portrayed, it is full of creativity." (Devlin, K. (2000) The Math Gene, p.9). Many children get bogged down with the numbers and miss the story.
 Create learning adventures! Redesign the way you present problems and scenarios. Incorporate elements of storytelling and detective work. Immerse the learner in the activity like readers are immersed in a story.
Identify essential learning outcomes
- What are the most important mathematical practices in this unit(s)?
- What mathematical practices are often combined in the "real world"?
- What do you want students to be able to do for years to come?
- For what understandings is it important that students know "why"?
Select a compelling starter(s)
Scaffold inquiry with a balance of pre-selected questions and opportunities for free inquiry
- Controlled. The teacher pre-selects the topic, questions, materials, and activities focusing on specific learning outcomes.
- Guided. The teacher provides options in topics, questions, materials, and activities, but may prescribe some aspects such as final products.
- Modeled. The teacher acts as apprentice to a teacher-coach. The student has flexibility in topics, process, and product, however the teach may provide scaffolding and examples along the way.
- Free. Students work independently or collaboratively as they explore meaningful questions, examine multiple perspectives, draw conclusions, and choose their own approach for information dissemination. The key is that teachers establish an authentic learning environment where questions spring naturally from the class discussions and meaningful content.
Use inquiry-based approaches to facilitate habits of mind related to mathematics.
Tie inquiry into homework assignments. In the article Five Hallmarks of Good Homework, Cathy Vatterott (2010) states that "Homework shouldn't be about rote learning. The best kind deepens student understanding and builds essential skills." She listed five big ideas:
- The task has a clear academic purpose.
- The task efficiently demonstrates student learning.
- The task promotes ownership by offering choices and being personally relevant.
- The task instills a sense of competence.
- The task is aesthetically pleasing, enjoyable and interesting.
Keep in mind that these don't need to be lengthy inquiries. For example, ask students to analyze an information graphic and write about it in their log. Read an adult's sports blog that shows how this could be done.
 Try It
Think about how inquiry-based approaches could be used for homework assignments.
Option 1 - Go to the World Statistics Day page form U.S. Census Bureau. Pick a statistics and create a simple inquiry-based activity.
Option 2 - Read Volunteer Portrait, Where We Volunteer and Volunteers . Brainstorms ways these information graphs could jumpstart an activity.
 Math is part of everything we do... we need to model connections across content areas. Think about life outside the school day. How do people use mathematics in their daily lives? Provide relevance with inquiries associated with topics of interest. We can support the other content areas and at the same time make learning authentic. Once you've learned the basics, it's time apply mathematics to your daily life.
Explore each of the following categories:
Try It
Choose one or more of the inquiry starter categories to explore.
Select one topic and brainstorm additional guidelines, strategies, resources, or other elements. Share your ideas on the workshop wikispace at http://inquirystarters.wikispaces.com/
Consumer Champion
 A Consumer Champion is aware of the importance of good financial habits and their connection to mathematics.
Consumer topics are a popular way to explore mathematics topics. Explore the Checkbook Assignment as an example. Notice how it incorporates real-world financial experiences.
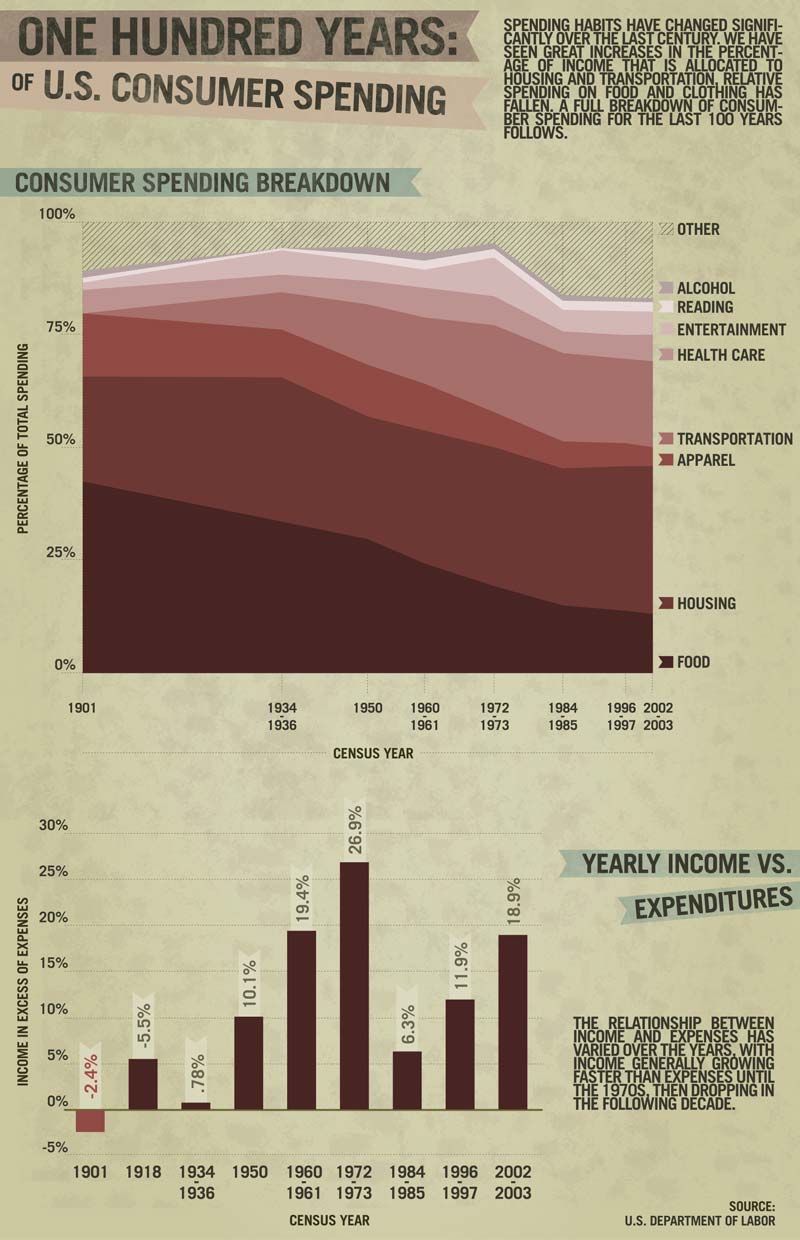
What are the financial habits of today's youth? Read the Financial Habits of America's Youth infographic to find out. Then, think about those topics that might appeal to students and also be important in developing good financial habits. How have people's buying habits changed over the past 100 years? Read the infographic One Hundred Years of Consumer Spending to find out.
Consumer Topic Infographics
- Hamburgers: The Economics of America's Favorite Food
- How the Little Things Add Up
- Movies & Shakers
- Flower Power
- How American Spends
- How Much Americans Spend on Shopping
- Soft Drinks
- Stop the Presses: Death of the Newspaper
- Tis the Season to be Wasteful
- The War Against Counterfeit Money
- What is Inflation?
- What is a stock?
- What are dividends?
- World's Most Expensive Cities
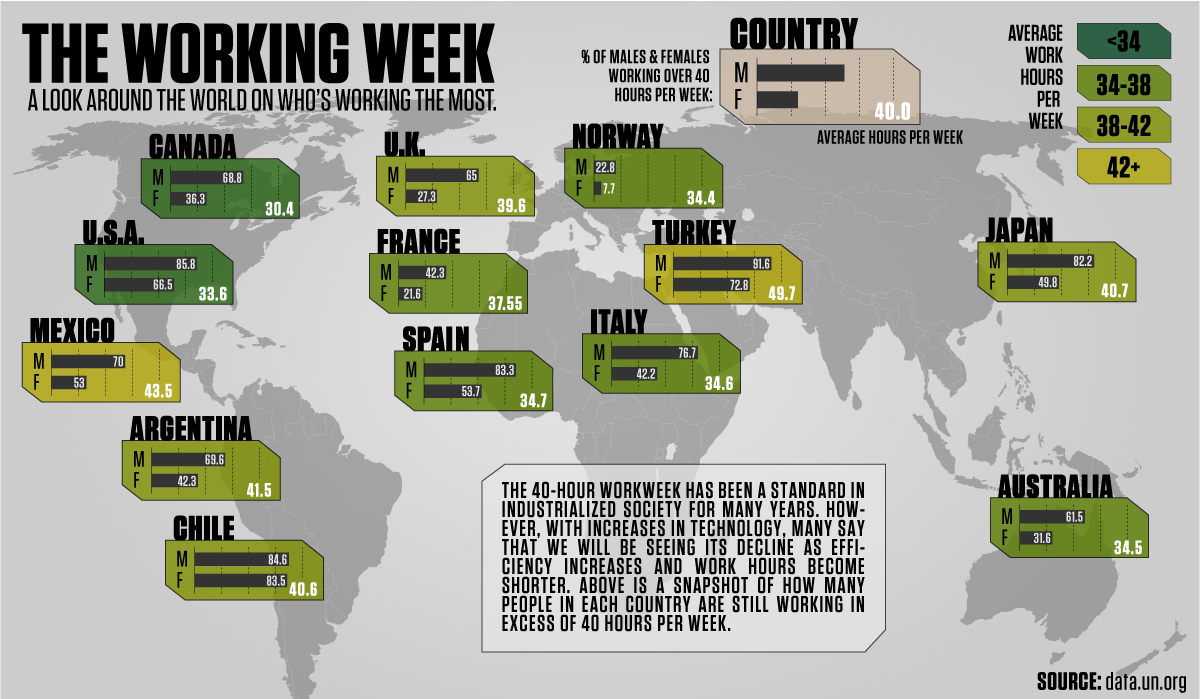
- Working Week
Financial Calculators and Conversions
- Currency Conversion - Option 1, Option 2
- Inflation Conversion - Best Option (formulas)
- Income Calculator - Option 1,
- Interest Calculator - Easy Option
- Money Counter - Option 1,
- Monthly Payments Calculator - Option 1
- Payroll - Best Option (formulas)
- Phone Bill Calculator - Option 1,
- Savings Estimator - Option 1
- Sales Tax Calculator - Option 1
- Tip Calculator - Option 1
Business Boom
Many people open their own small business. Do you know anyone who runs their own business?
Read the U.S. Census Bureau report on business ownership.
Go to the Business page and find the city closest to where you live. Click GO.
Buyer Beware
Explore websites that contain consumer information. Select a product and make comparisons. Create a list of features or characteristics to rate. Create an apply a rating system.
- Consumer Search
- Federal Citizen Information Center
- Good Stuff? A Behind-the-Scenes Guide to the Things We Buy
Company Claims
Fruit-packing and cherry-picking involves choosing data to fit particular needs. It's a lie by exclusion. General Mills claims that Cheerios reduces cholesteral. Is this true? What are the facts? How could they look different on different graphics? How can charts and graphics be made to look more or less dramatic? Read the article about the Cheerios Claims. Select an ad that makes a claim. Check out their math.
Clothing Camp
Read Pant Sizes.
Corny Corn
Read ECORNomics. Corn is woven throughout our economic.
Deal Digger
Explore online shopping websites. Then, choose an item and compare the same item at three different online stores. Be sure to consider shopping costs.
Art and Office Supplies
Pencils, sticky notes, and file cabinets are just a few of the things you'll find at office stories. Check it out:
Whether you like reading books or listening to music, you can find online store with your favorites:
Department and Clothing Stores
If you need new clothes for a special occasion or a gift for a friend, try a department or clothing store:
Electronics Shopping
Looking for computers, televisions, games, phones, or other technologies? Try these stores:
Gifts
Looking for a special gift for a friend or family member? Try the stores below:
Grocery Shopping
From fresh fruit to tortilla chips, you can find all the groceries you need at the links below:
Health and Beauty
Don't forget the toothpaste and deodorant! You can find them at the stores below:
Home Improvement
Whether you need a new water faucet or want to carpet your bedroom, find the prices online:
Sporting Goods
Do you need a new pair of running shoes or a fishing pole for vacation? Try a sporting goods store:
Energy Experts
Read the Energy Consumption infographic. Apply it to your life. Create your own infographic that shows your consumption.
Fuel Fiasco
Americans spend lots of money on fuel. Read What America Spends on Gas.
Figure out fuel costs. Use Fuel Consumption - Option 1, Option 2, Option 3
Gas Glut
Have you ever been in a car that ran out of gas? What would happen if the gas stations in your neighborhood closed? Where could your parents get gas?
Read A Gas Station for Everyone. How big is your town? Do you have as many gas stations as the national average?
Inflation Inquiry
Read the infographic What is Inflation?
Go to Google Books. You can find online magazines to explore. Make comparisons of product prices over the years. Account for inflation.
- American Cowboy (1990-present)
- Baseball Digest (1940-present)
- Bicycling (2006-2008)
- Indianapolis Monthly (1990-present)
- Men's Health (2006-present)
- Mountain Bike (2006-present)
- New York Magazine(1965-1997)
- Popular Mechanics (1900-2005)
- Popular Science (1870 to 2008)
- Prevention (2006-present)
- Running (2006-present)
- Vegetarian Times (1980-2004)
Memory Mogul
What does it mean to have an 8GB flash drive? How many songs can I get on an iPod? How many text messages can I send for the plan that I use?
Create an infograph containing charts and graphs showing information about technology you own or would like to own.
Use Computer Storage - Option 1, Data Transfer (download) Speeds - Option 1, Option 2
Penny Project
Explore the MegaPenny Project.
Do you think we should keep making the penny or not? What is the cost of producing a penny? What would happen if we didn't use pennys?
Compare the information on the following articles:
Pet Patrol
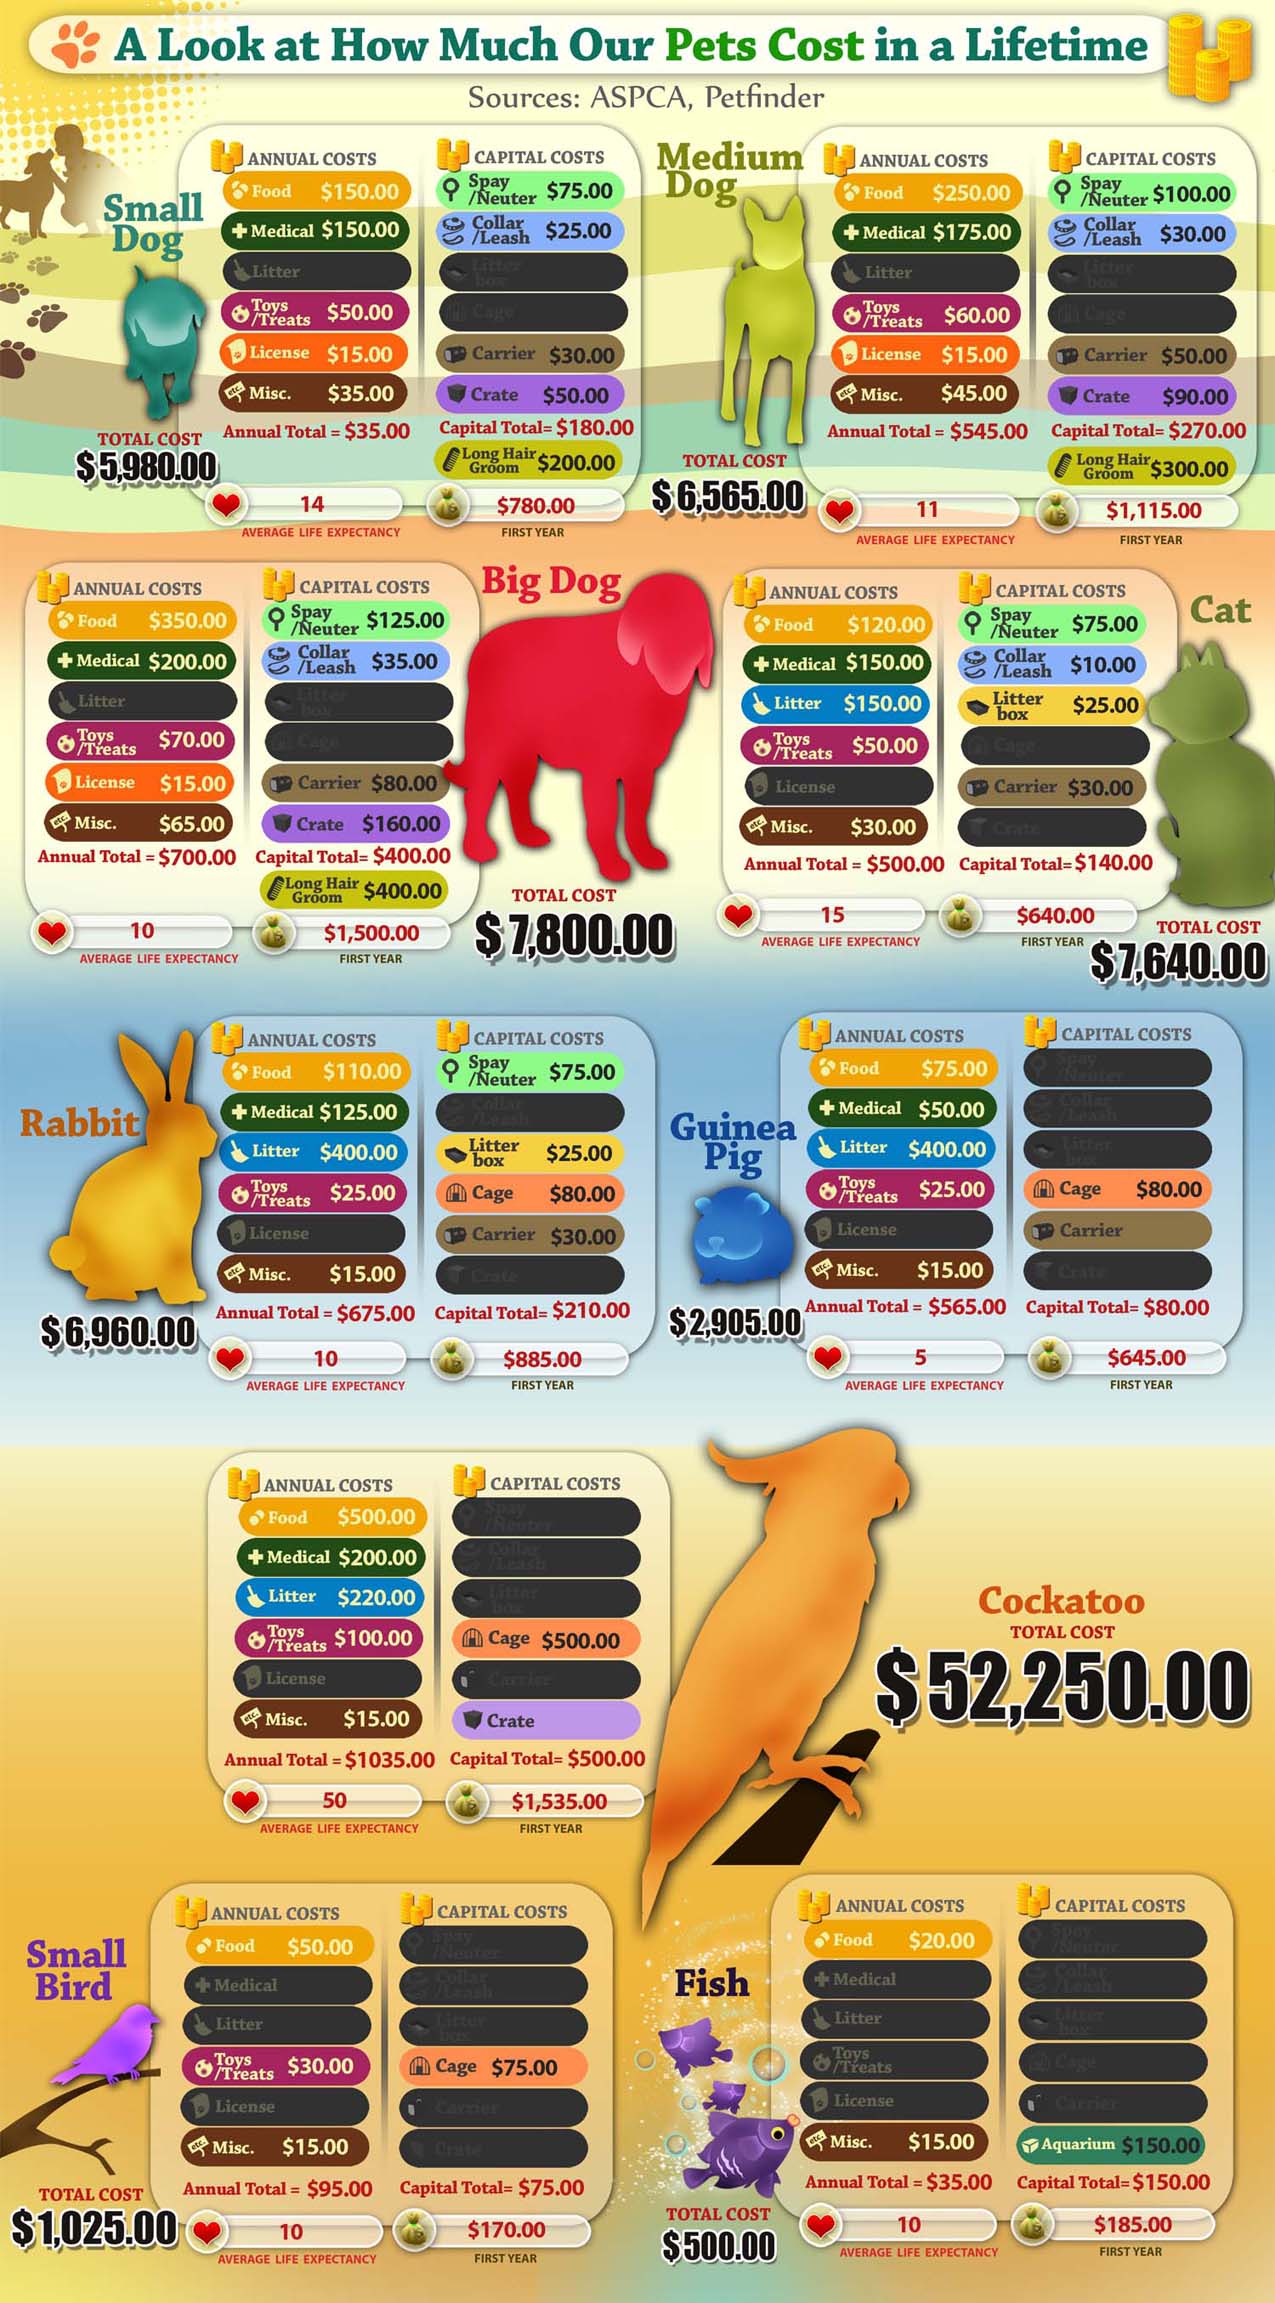
Read the infographics Pet Obsessed: The Cost of Cute? and How Much Our Pets Cost in a Lifetime. How much does it cost to own a pet? Compare the information in these two infographics.
Super Shopper
Are your spending habits like other Americans? Read How Much Americans Spend on Shopping infographic. Talk with your parents about family spending. Is it like or unlike the national average?
Dynamic Designer
 Do you like to build and create things? If so, you're a dynamic designer! Use the Math by Design interactive to get young people thinking about math and design.
Angles and Architecture
- Identify features in the school building. Take photographs.
- Create a architecture tour of your town.
- Identify the geometry of a famous building. Compare it with a peer. How are they alike and different?
- Websites
- Math Skills: Identify types of angles (acute, obtuse, right), recognize two- and three-dimensional geometric shapes (equilateral triangles, squares, right triangles, diamonds, circles, semi-circles, prisms, pyramids, cones, domes, spheres), identify parallel and perpendicular lines, find symmetry (reflections, rotations, translations, combinations).
Aquarium Action
- Identify a location in the classroom.
- Write a proposal that includes a tank, accessories, and fish to purchase.
- Use online aquarium data
- Select the fish based on the size of the tank.
- Math Skills: Interpret charts, compare costs, calculate sizes, make decisions
Business Bonanza
Creating your own business is a popular student activity.
Use Mr. Nussbaum'sLogo Maker to create a badge or logo. Also, use the Card Maker to create a business card.
Use the US Currency Generator to create money for consumer activities.
Geek Squad
Do you love technology? Check out the Home Improvements for Geek infographic. Create your own with prices and total cost.
Get a Grip
Do you use the right tool for the job? Read Get a Grip. Notice the angles of the tools. Invent a tool. Be sure the angles match the object.
Handy Home Help
Think about the money you could make helping people in your neighborhood build and repair things. Plan and project and figure out costs.
Landscape Launch
Read the info graphic A Plan for All Seasons. Also, read the article. What plants would grown in each season where you live?
What soil is needed? What plants? What watering? Look at angles.
- Burpee Seeds Catalog
- Measure a real plot in your school yard approximately 30 feet by 30 feet. Provide a budget such as $350. Work with grant money from a website such as National Wildlife Federation.
- Issues
- Consider local temperatures
- Consider sunlight
- Consider deciduous or evergreen
- Consider perennials or annuals
- Consider vegetables that can be harvested
- Math Skills: Design using geometric shapes, create a diagram to scale, estimate costs
Make It Math
Read Speed Demon comic. Create one. What are the angles that you used? Label them on your plate. Try a plate with different angles. Compare the results.
Snow Globe
Read Snow Globes. Notice the size of the foil squares. How many can you get on different sizes on aluminum foil?
Shirt Shop
Read the Express Yourself comic. Design your own shirt. How much would it cost to start your own business?
Sports Clothes Caper
Do the clothes you wear really impact your performance? You decide. Read about the Russian Football Team.
Quilt Quest
Mathematical Quilts by Elaine Krajenke Ellison
Learn about the symbols sometimes used in quilting at Pathways to Freedom.
- Explore the history of different patterns.
- Invent a pattern and name that fits your life. My wii mii pattern or my musical note pattern.
- Math Skills: recognize properties of regular polygons and equilateral triangle, measure angles, find sum of measures of interior angles, identify symmetry, identify congruent figures.
Entertainment Expert
 From sports and hobbies to travel and movies, an Entertainment Expert knows the mathematics of the entertainment industry.
Americans spend lots of their money on entertainment. Read the infographic Trends in American Entertainment Spending. Think about those activities and skills at appeal to young people.
What Phil Mickelson: Math, Science, and Golfing at YouTube. Or watch the video on the right. Double-click the video to start and stop. Here are some examples of sports math:
- Batting average, yards per carry, shooting percentage, mean batting averages, range
- Design an obstacle course or other set-up in your classroom and figure out statistics
- Sports
- local information - bike stats
- professional statistics websites
- Informational - sizes and types of fields, balls, velocity, etc.
You can find lots of graphic sports infographics to stimulate thinking. Go to Sports Designer for other examples.
- Boxing
- Chess
- No Funds Left: The Rising Cost of Being an NFL Fan
- Powerboats
- Race in Sports
- Santana's Change Up
- The Tiger Woods Economy
- Tour de France
- New York Yankees
Travel and Tourism Infographics
An American Vacation
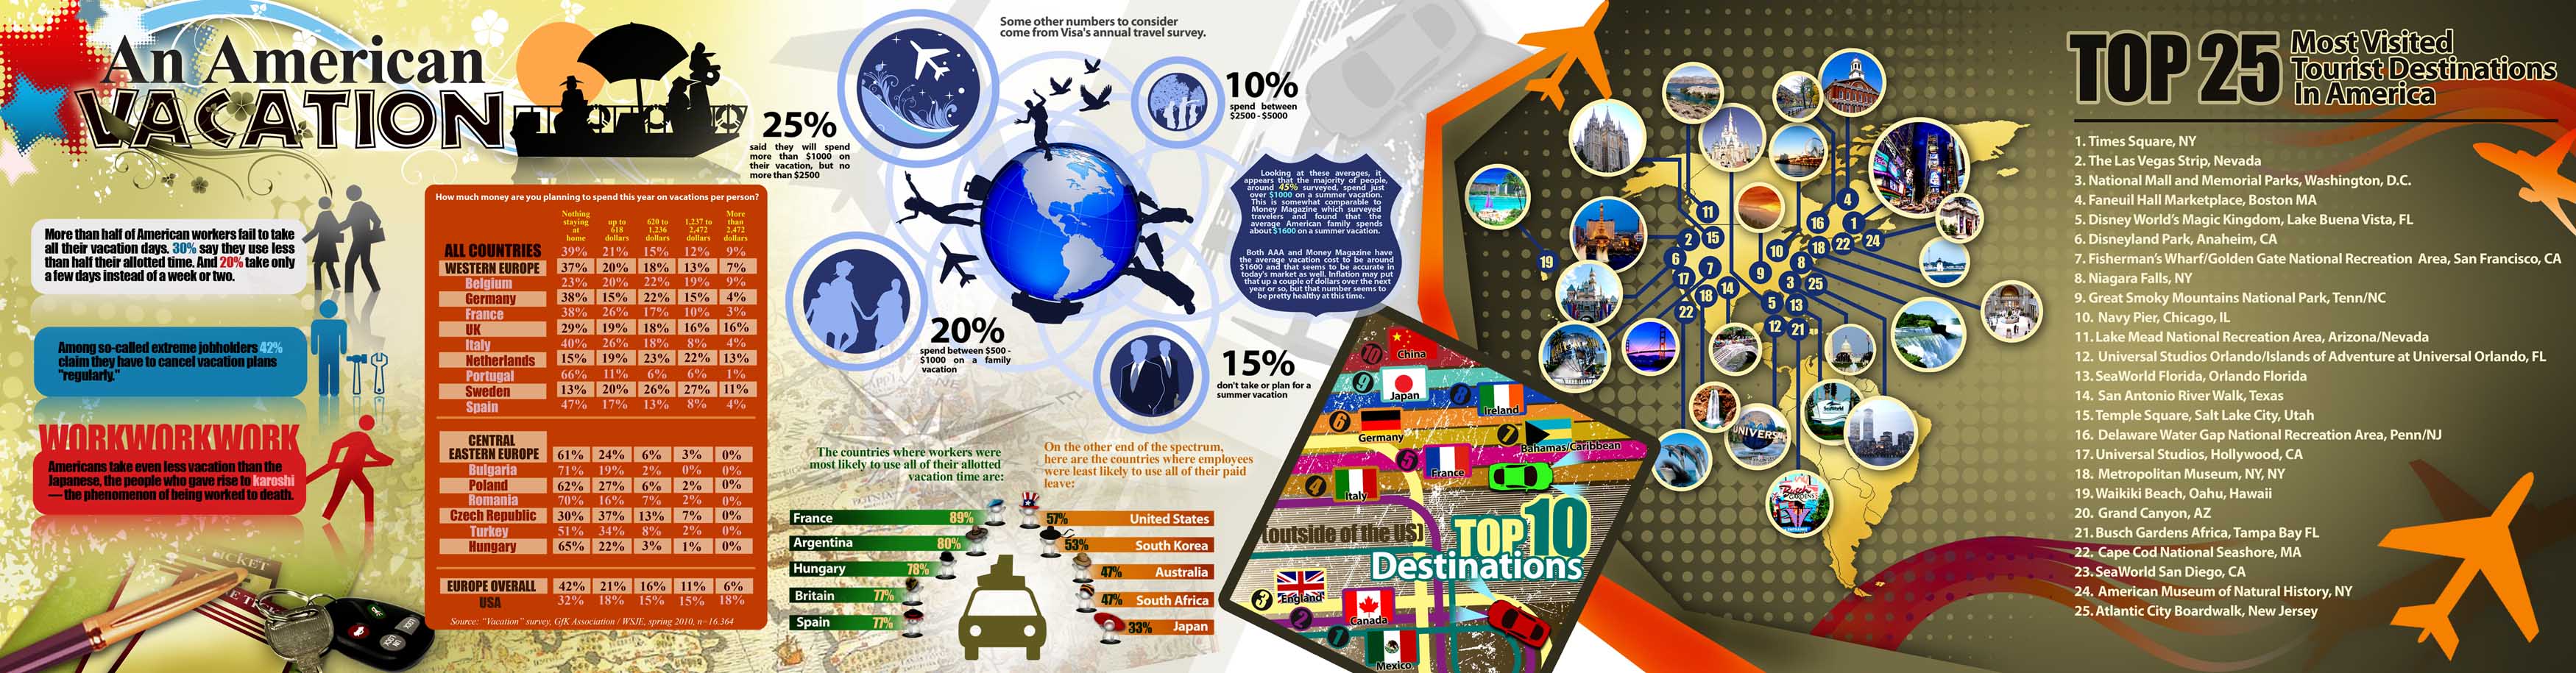
Read the infographic An American Vacation, The Return of the Vacation, and Vacation Daze. Compare these three infographics. How is the information alike and different. What different methods are used to present information.
American Idol Arithmetic
If you're an American Idol fan, then you already know how it works. People vote for their favorite singers. Read the FAQs and create an infographic to visualize the data.
Club Capers
Some clubs are free, but others cost money. What club would you like to join? Compare the features of health clubs, video clubs, or other groups of interest. Search online for club information.
Cruise Ship Chaos
Read the Cruise Ship Infographic. Would you like to go on a cruise? Pick a piece of information on the infographic to analyze.
Fishy Fish
Read Fish Stocking
Fourth of July Fun
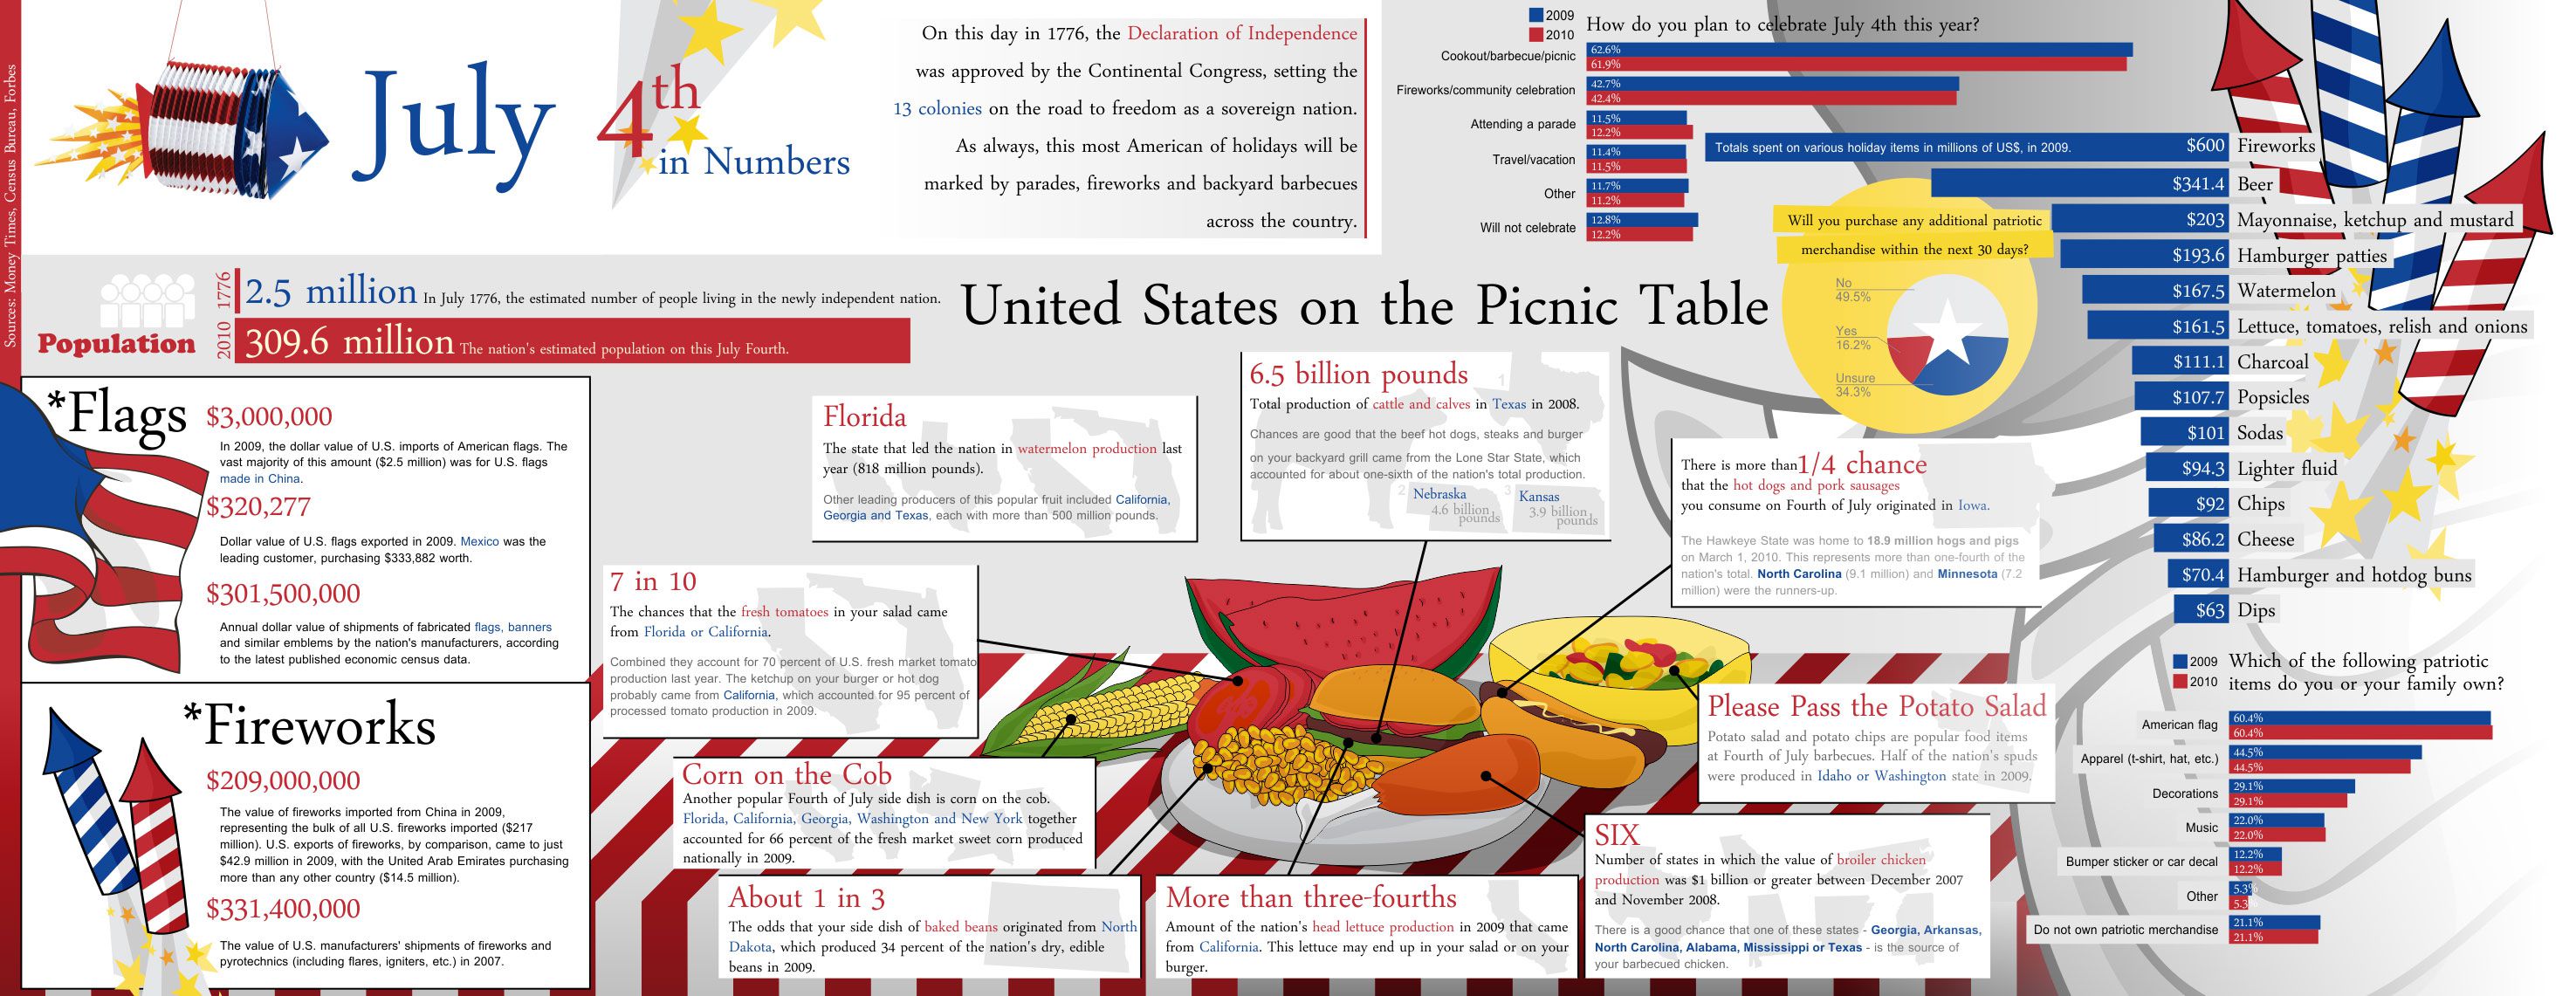
Read the infographic Fourth of July by the Numbers. Compare it with America's Birthday Statistics.
Gaming Graphics
Read How to Beat Super Mario. Create your own gaming infographic.
Halloween Happenings
Narrow your plans to three Halloween costumes and compare the costs. Be sure to include accessories such as makeup, fake blood, hats, or other items. Use the following website for pricing. Then, figure out sales tax and shipping costs.
Lego Legend
Explore the Lego website. Wow! There are lots of choices. Select three lego sets. Figure out the cost per piece. Which set is the best deal?
Movie Master
Read Rotten Trilogy Finalities infographic. Do you agree?
Read Back to the Future Movie Timeline. Create a timeline for a film you've enjoyed.
Read the Famous Movie Quotes. Create your own.
Read Movie Character Interaction.
Read 50 Movie Cars. Create your own info graphic for another collection of television or movie information.
Is it better to rent movies or buy movies? You decide. Go to the Netflix website.
Names by Number
What are the most popular baby names? How popular is your name?
Read The Muppets Names Venn Diagram
Olympic Odyssey
Read the infographic What Country Has The Most Olympic Gold? What's the answer to this question? Or, are there many answers?
Parties in the Park
Plan a trip to a national park.
- Distances. Use Google Maps to help you determine the distance from your school to the national park.
- Costs. Determine the cost of driving and two nights lodging at or near the park. Include the entry fee.
- Features. Create an info graphic that includes features of the park and information about hiking trails. Use at least two different types of charts or graphs.
Party Planner
Go to the Oriental Trading website. Select items for a party. Figure out the price per guest.
Reader Review
Read the infographic Books vs E-Books. Locate three more recent articles and compare the information.
Really Randumbness
Read the infographic The Lottery Economy. Are you likely to win the lottery? Randumbness is a term coined by Charles Seife in Proofiness. It involves insisting there's order where they're actually chaos such as in gambling situations.
Explore Lottery Numbers - Best Option, Option 1,
Soccer Superstars
Read the infographic Soccer's Slim Salaries. Compare these salaries to other professional sports. How do they compare?
Ticket Triumph
Go to Ticketmaster. Find a concert within 500 miles of your house. Figure out the cost of the tickets for you and your friend. Figure out the cost of driving.
Time Zone Travel
When you travel a lot, it's important to know about the time zones. Use the Time Zone page to figure out how you could call friend around the world without waking them up. Create a chart showing the best times for people to connect living in different time zones. Choose locations on at least three continents.
Timbuktu Travel
Read Travel and Tourism infographic. People come from all over the world to vacation in America.
Plan a trip to an amusement park (Legoland, Disney World, Zoo, Sports park), historical sites, or scientific sites.
Wii Warrior
If you like to play wii games, you may be a wii warrior. Keep track of your scores from a wii or other video game over a week's time. Use mathematics to describe your progress.
Science Star
 Whether you're interested in life, earth, space, or physical science, there's lots of possibilities for inquiry.
Animals Attacks
How many animals attack humans each year. Is it likely that you'll be attacked?
Beaufort Basics
Read the Beaufort Scale comic contain it to Beaufort Scale chart. How is the format and information alike and different? Who might use the scale? How might this scale be useful?
Big Brother
Read the infographic Big Brother: Satellites Orbiting Earth
Birdhouse Bonanza
Explore the sizes needed for different birds. Look at houses, food, and life cycles. Use the bird cams.
Clean Clear Air
Read Clearing the Air
- AirNow Air Quality
- Learn about the Air Quality Index. Use the National Air Quality Summary to make comparisons between different locations.
- World CO2 Emissions infographic
Coorelation Capers
Coorelations can use misleading arguments. According to Seife, some people made connections between Nutrasweet and brain cancer in the 1980s. However according to Charles Seife in Proofiness, it's more likely that the increase in MRI availability increased the identification of brain cancer.
Dark and Deep
Read Deep Water Horizon
Dinosaur Debate
There's a problem with approximations. Did the dinosaurs really live on those exact dates?
Disaster Dilemma
Read Hungary's Toxic Sludge Spill from National Geographic. Explore a river in the United States. What if this type of disaster happened in the US?
Create both individual and group plans. Explore the services, costs, and preparation.
Drought Drama
Read the Drought Severity scale.
Earthquake Epicenter
Explore statistics from the earthquake center. Read the Modified Mercalli Earthquake Intensity Scale. How far have earthquakes been located from where you live?
Read the infographic Earthquakes.
Endangered Animal Explorations
Figure out where and how to reintroduce animals. What's the gestation period?
- What can be done to save the species?
- What is the cost of preservation eforts?
- What are the chances of long-term survival based on current statistics?
- Math Skills: Interpreting data and making predictions?
Environmental Footprint
Read Greening Walmart: Is the Giant's Footprint Shrinking? What's your impact on the environment?
Read the infographic Water Footprint.
Get the Eco-Calculator widget
Fight Fires
Explore statistics about smoke alarms.
- Children and Smoke Alarms. This page contains facts and statistics.
- Fire Safety Fact Sheet from Safe Kids. This page contains a chart and facts.
- Focus on Fire Safety: Smoke Alarms. This page contains facts, statistics, and higher-level information.
- Safe Kids Oregon. This page contains facts, statistics and the Oregon law.
- Smoke Alarms from FEMA. This page contains dates, usage data, and costs.
- Smoke Alarms from FireSafety.gov. This page contains statistics and use information.
- How Smoke Detectors Work from How Stuff Works. This page contains pricesand electronic information.
- Oregon Rules for Smoke Alarms. This page is written at a high reading level, but can be skimmed for the law.
- Media
- Smoke detector. Image
Create a warning about fire using the Warning Label Generatorand Warning Sign Generator.
Habitat Happiness
Build a habitat that would make an animal smile. Use Habitat Maker to create your own habitat. Or, use the Panda Habitat project.
Human Waste Horrors
Read Poopnomics: The Economy of Human Waste
Hurricane Happenings
Read the latest statistics on Hurricanes and Tropical Storms. Read Saffir-Simpson Hurricane Intensity Scale. Create an infographic showing hurricane trends.
Innovative Inventor
Create at least one of the following projects. Then, make it better. How can you improve on the invention?
- CD Hovercraft
- Cosmic Cooker
- Cut to the Point
- It's a Plush Life!
- Letter Writing (making paper)
- Musee du Dodecahedron
- Pinwheels
- Robofingers
- Simple Electronic Motor
- Sled on a Thread (working with angles)
- Soda Bottle Sub (conduct some experiments with weights)
- Spectra
Insect Invaders
Use Insect Generator to create your own insect. Read the Beetle infographic. Create your own infographic for your own "bug invader."
Landform Laud
A laud is something that celebrates a person, place or thing.
Read the Seven Summits Infographics. Create your own graphics about another landform.
Mining
Read infographics
Mythbusters Mania
Go to Mythbusters to learn about the television show.
Go to How Stuff Works - Science Versus Myth and choose a topic to explore.
Create a comic to show your results.
Noble Nature
Explore patterns in nature. Start with the following ideas. Create a slideshow highlighting math in nature:
- Snowflake websites
- Spirals: pinecones, sunflowers, pineapple, Milky Way Galaxy, snail shell, morning glory buds, daisy heads
- Reflections: ponds, lakes, rivers
- Crescents: Borchan
- Pentagon: Star sapphire, starfish
- Polygons: Spider webs
- Spheres: planets, moons, stars
- Lines/arcs: flower stalks
- Cubic Crystals: salt
- Cylinders: earthworms
- Elliptical: orbit of comets
- Hexagons: snowflakes, honeycombs
- Circle: fairy ring mushrooms, ripples in water, diatoms, tree rings
- Symmetry: Queen Anne's Lace, Butterfly, fruit, human body
- Angles: constellations
- Create a Glogster poster
- Math Skills: identify shapes, identify symmetry
Powerful Patents
Go to Google Patents. Trace the history of a particular type of device. Speculate on the future of this invention. Create your own patent using the format of a formal patent.
Recipes for Fun
Did you know you can make chalk? Read Let's Talk About Chalk. If we want enough chalk for the entire class, what supplies will we need?
Read about Ice Cream. If we want enough for the entire class, what supplies will we need?
Reduce-Reuse-Recycle
Read The Digital Dump, Throw Away Culture, and Hidden Toxic Waste infographics.
Compare national and local statistics.
- What are the benefits of recycling?
- What are the costs?
- Is recycling worth the effort? Why or why not?
Watch PBS's Loop Scoops.
Be a Math Detective. Read the articles and find the facts and figures.
Resources
For Teachers
River Rally
Who would happen if the Mississippi River ran dry? Read the infographic Colorado River is Drying Up.
Rock Referee
Let's build a "Rock Hall of Fame" featuring one of each type of rock. You'll be the rock referee and decide who gets in and who doesn't. What types of rocks will you buy? What information do you have about them? How much will they cost to purchase? Where can you collect them for free? How much will it cost to go to this location to collection? What equipment will you need? How much does it cost? How much are the chemicals for testing? What if you want to make plaster casts of fossils? What's the recipe and how much do you need to make?
Size Salon
Read Actual Sizes by Jenkins. How big is big? Create scale models.
Space Sagas
Explore distances and time. How much space would you have if you have 2 feet by 2 feet by 2 feet to store your personal items? What could you take with you?
Space Exploration
Read Space Exploration
Serious Survival
Tongue Tales
Read The Tongue
Tornado Trouble
Read the Fujita Scale for tornadoes.
Tree Ring Travels
Do you know that you can travel back in time? Just look at the rings of a tree. Explore the timeline of a tree using tree rings. Create a diagram of a tree ring for your lifespan.
Volcano Voyages
Read Where will the next volcano erupt? infographic.
Wacky Weather
Create an infographic containing the weather information and history for your area.
- Incorporate temperature (high and low), wind speed, wind chill, barometric pressure, degree of cloud cover, precipitation
- Incorporate time of sunrise and sunset, normal high and low, coldest and highest temperature, severe weather
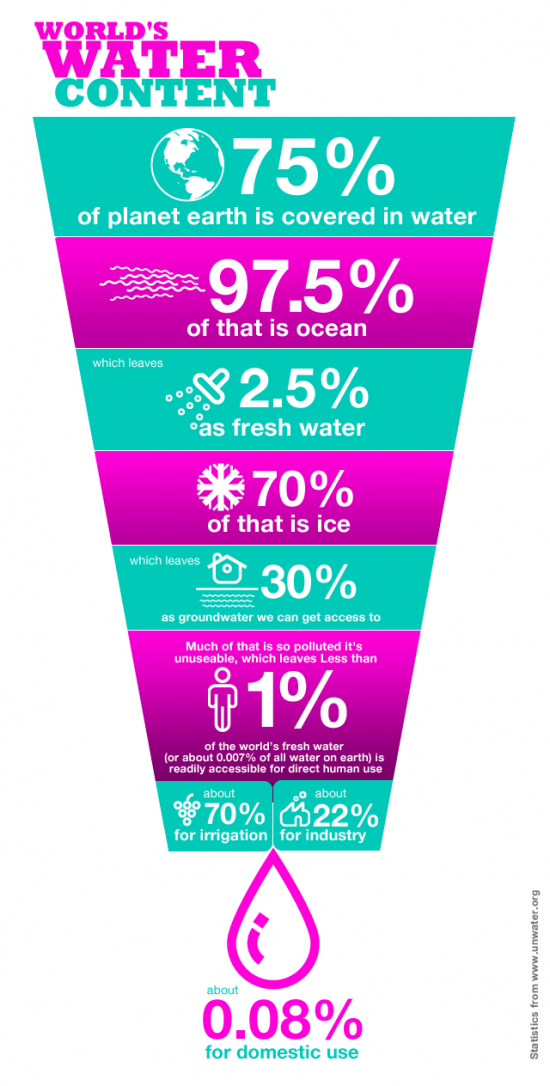
Water World
Read the infographic Water, Water Economics and World's Water Content to learn about water around the world. Read How Clean Is Your Tap Water?
Super Citizen
 A Super Citizen is a good digital citizen. Some young people meet with friends online. Some youth join social networks. Although this can be fun, it can also be dangerous.
- Who is online?
- What tools are they using?
- How can you be a safe online?
- What does it take to be a good digital citizen?
Let's find out! Social technology are tools that help people talk, communicate ideas, and collaborate on projects. These tools are growing quickly! Read the visual below to see how fast people are joining social networks.
Explore Social Web Involvement infographics.
Africa Analysis
Aging America
Americans are getting older. Read the infographic An Aging Population and Average Age of Congressman. What are the implications of an aging population? Use statistics to support your claims.
City Synergy
Read An Old City. Trace the history of your city on an infographic.
Digital Diary
Read How the Digital Revolution Changed Our World. Create a timeline showing how technology has changed in your lifetime.
Festival Frenzy
Many communities have festivals to share local pride. You could celebrate your culture, foods, music, or natural areas. What's special about the place where you live?
Select a website and logo. Collect information and design the logo. Work as a team to decide now many shirts might be purchases based on the number of people who might attend. Check the cost of extras such as glow-in-the-dark, labels, front and back, quantities.
Immigrant Inquiry
Read Nation's Foreign-Born Population Nears 37 Million from the U.S. Census Bureau. Also read Immigrant Labor. How many people in our class are foreign born? What about parents and grandparents?
Read Illegal Immigrants
Laws
Read the infographic How Our Laws Are Made.
Minority Majority
Did you know that the minority population in the United States will be the majority by 2050? Read about this interesting trend at CNN.
Go to the Minority page at the U.S. Census Bureau. Select a group you'd like to learn more about.
Moving
Read Where Americans Are Moving and Visualizing Human Migration.
Powerful Poverty
Many people in America and the world are poor. What does it mean to be poor? What's the difference between the rural and urban poor?
Read the infographic America's Poor and On the Rise: Poverty in America.
Super Spenders
Governments spend lots of money each year. Different groups look at how money is spend and create charts and graphs to support their arguments. Examine the following infographic. How does the data they selected support their cause? Read War Resister's League.
US Us
Read The State of the United States and What Americans Love and Hate About the U.S.A
Volunteer Victories
Read Where We Volunteer, Volunteer Portrait, and Volunteers.
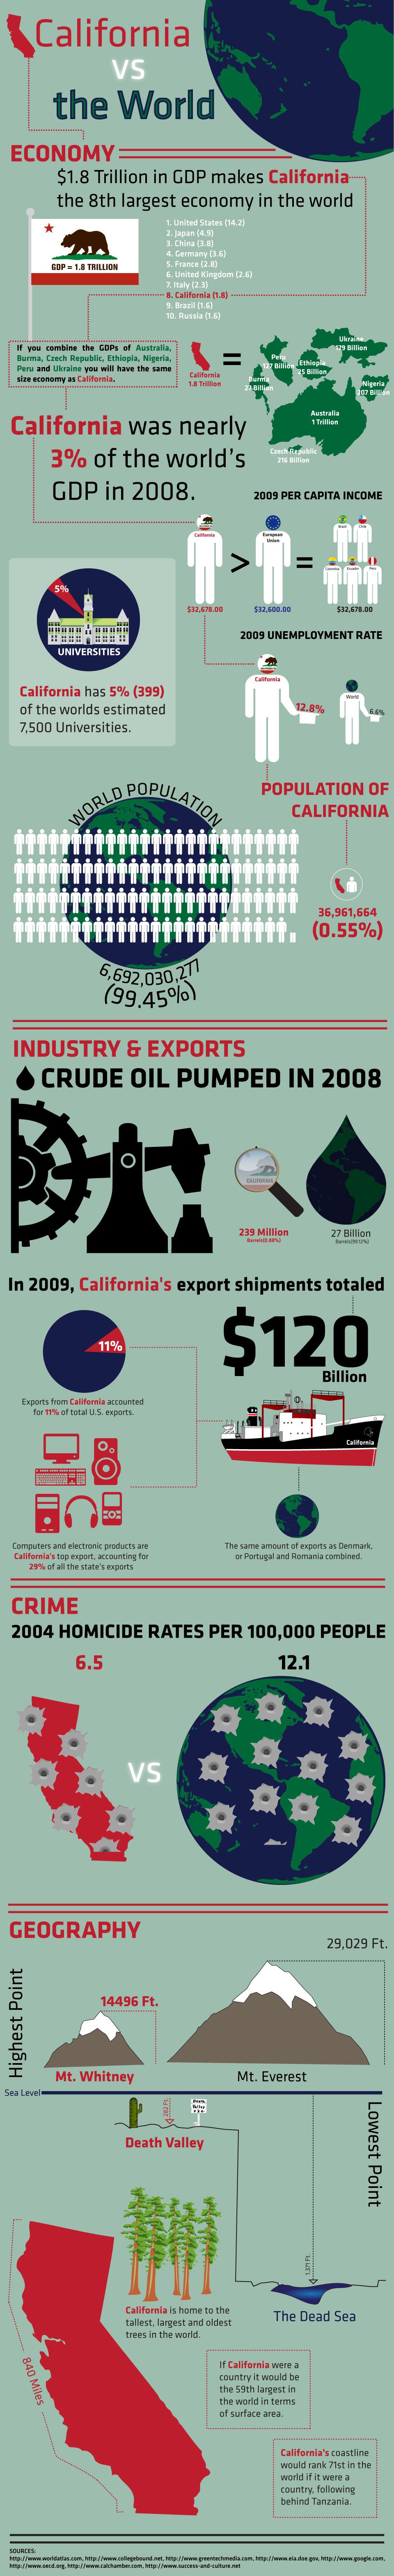
World Watchers
Read California Vs the World infographic to see how the state of California compares to the world. Choose a state and create your own infographic.
Wellness Wizard
 A Wellness Wizard knows about ways to stay healthy through good nutrition, health, and fitness.
Read the Let's Move infographic focusing on Childhood Obesity. Get young people interested in wellness through sports. Check out a bunch of sports infographics.
Better to Bike!
Read The Rise of Biking and Walking, Biking in Minneapolis and Clif Bar Challenge.
Read the Commuting and Obesity and Driving is Why You're Fat infographics.
Calories Counter
Read the article How many calories do you burn playing wii?
- How much are you eating?
- Are you eating nutritional meals?
- Check the calories at restaurants
- Math Skills: Reading labels, collecting data, estimating, decimal computation, finding the mean, drawing conclusions
Challenges
Many people deal with challenges in their life and excel! Read the infographic from the Paraolympics.
Consuming Consumers
What do Americans eat? Read the infographic What Are We Eating? to find out. Compare this to the Food Pyramid.
Deadly Disease
Read the infographic Diseasome.
Doping Drama
Read the infographic Olympic Drug Testing Program and Sports Doping. What is your position of this topic? Use facts to support your position.
Exercise Excellence
Use a Stopwatch tool and determine targe heart rate, find percent of a number, and round g numbers.
Use fitness tools such as BMI - Option 1, Calories Burned Running - Option 1, Running Calculator - Option 1,
Fish Food Friends
Read Which Fish to Eat?
Fast Food: Fit or Fat?
What are you eating? Read What Are We Eating?
Read the infographic Fork It Over.
Read Summer of Food
Food Fairy
Is there a food fairy? Where does your food originate?
Read Food and It's Context and How Far Your Produce Travels.
Read Organic Brands
Food Safety Fiasco
Have you ever wondered what might be growing in your refridgerator? Is it safe?
Create a warning about food safety using the Warning Label Generatorand Warning Sign Generator.
Healthy Habits
Read the info graphic Who's Not Washing Their Hands? Create a poster reflecting the most important information for your peers.
Household Health
People in different parts of the United States spend different amounts of money on health care.
Read Census Bureau to Survey Nation's Spending Habits.
Illness Inquiry
Read Salmonella Outbreak
Injury Investigations
Read the article Sports and Recreational Injury. Check out the infographic on your chances of injury.
Create a poster showing the most important statistics and information to help young people prevent injury in sports.
Locker Ledger
Plan a weight-room. Plan a yoga room. Plan another types of sports or fitness location.
Luscious Lunch
Follow the requirements of the National School Lunch Program. Design a good lunch.
Think about Nutritional Values.
Nutrition News
Analyze nutritional values and portion sizes.
Restaurant Rally
Model with your own dinner order. Individual orders, check table orders and compare results. Share a dessert. Work together on tax and how much each person owes. You save 10% if you put two groups together. Figure out how much you'll save.
Center for Safety
Read Soda Bottle Goggles.
Spinal Cord Statistics
Read about the Spinal Cord injuries in the UK. You can find information about injuries in the US for comparison?
Sports SuperStars
Compare the statistics of two sports superstars.
Teeth Talk
Do you take care of your teeth.
Read the Take Care Of Your Teeth and The Health of Teeth infographic.
Thanksgiving Thunder
Can you hear the Thanksgiving Thunder? It's the roar of turkeys running for the door! How many turkeys do you think are eaten every Thanksgiving? Read a turkey production graph. Do you think will we have enough turkeys year?
Read Thanksgiving Facts from the U.S. Census Bureau. Compare this to Talking Turkey.
Let's explore some other turkey facts:
- USDA Reports an Increase in the Average Weight of a Turkey
- 2008 Turkey Output
- Turkey Hatchery Reports
Traffic Trouble
Read the infographic Road Traffic Accidents. Are you likely to be in an accident? What statistics concern you?
Wellness Walk
Read the infographic Dead Man Walking. Is your town a good place to walk? Why or why not? Back up your thoughts with data.
Wellness Works!
How many calories do you burn in a day or a week?
Select an activity and figure out how many calories you would burn. Compare to other activities.
Use the links on the left to move through this online workshop.