| Outside the Book Home | Recipes for Success | Sequential Art & Technology | Get Graphic in the Academic Library |
Learn to use technology tools and resources to promote graphic inquiry, collaboration, and communication to across disciplines. People of all ages are motivated by graphic communications.
This visually rich session was designed for academic librarians.
For a more in-depth exploration, read the graphic book Graphic Inquiry by Annette Lamb and Danny Callison available from Libraries Unlimited, coming Spring 2010.
For the online workshop, Get Graphic.
This presentation is divided into three sections: Types of Graphics, SCORE IT, and Focus on Inquiry.
Types of Graphics
 What are the possibilities for visuals in learning?
- What types of visuals are most useful in particular disciplines?
- How can I convince faculty to use visuals in teaching and learning?
Graphics are visual representations created on paper, the computer screen and other surfaces to communicate information. Use graphics to provide an additional channel of communication for learners.
As you select materials, think graphics. For example, The Mask of Lincoln from the National Portrait Gallery shows the many ways Abraham Lincoln was been viewed.
As you build graphic learning environments, think about the inquiry process:
- The Learning Outcome - What do you want learners to be able to do or talk about when they've completed the learning experience?
Example: How do folk heroes contribute to a country's culture?
- Question and Explore - How can graphics be used to stimulate thinking and jumpstart the inquiry process?
Example: Examine historical posters, advertisements, and postcards for evidence of folk heroes.
- Assimilate and Infer - How can graphics be used to help inquirers organize, apply, and synthesize information?
Example:
Use a graphic organizer to compare characteristics of folk heroes.
- Reflect and Share - How can graphics be used to provide feedback and communicate solutions?
Example: Use photographs to communicate modern folk heroes of a particular region.
Let's explore seven types of graphics and how they can be used during inquiry:
- Data, charts, and graphics
- Diagrams
- Illustrations
- Maps
- Organizers
- Images
- Symbols
Data, Charts and Graphs
Numeric data are often represented using charts and graphs. Explore an example of social technology and data sharing at Data from Swivel, a collaborative environment for sharing and visualizing data.
Digital Resources
- General Teaching Resources
- Data Sources
- Online Survey and Poll Builders
- Online Graphing Tools
Seek out online data for your own professional development. This is a great chance to model the use of technology. Try Pew Research Center and Pew Internet & American Life Project.
Inquiry Connection: Data
- Question & Explore - Who decided how many parking spaces are set aside for people with disabilities? Will we need more with an aging society? Graph people with disabilities by age.
- Assimilate & Infer - Locate parking space data and ADA requirements. Collect data in school parking lot. Graph results. My graph shows the school has the minimum spaces required by law.
- Reflect & Share - How many people in our school have disabilities? Interview staff. Graph results at Create a Graph website.
Diagrams
Diagrams are a simplified visual representation of an object, concept, or idea.
Digital Resources
Inquiry Connection: Diagram
- Question & Explore - Why it is hot in the winter and cold in the summer in Australia? Interpret a diagram showing the tilt of the earth.
- Assimilate & Infer - I notice that in the winter the sun shines in my bedroom window.
- Reflect & Share - What did ancient cultures know about the seasons? Examine diagrams of Stonehenge and create my own interpretation.
Illustrations
Drawings, paintings, sketches, and etchings are examples of illustrations. These visual representations are intended to communicate an informational or artistic message.
Digital Resources
- Art
- Avatars
- Cartoons and Comics
- Character Generators
- Clipart
- Posters
- Indian Ledger Art
- Posters
- Visualizations
Inquiry Connection: Illustrations
- Question & Explore - What was it like to go on a buffalo hunt? Why did they use ledger books?
Read the book The Ledgerbook of Thomas Blue Eagle and explore websites about ledger art.
- Assimilate & Infer - Draw pictures to better understand the dwellings and daily life.
- Reflect & Share - How do the images created by Indians differ from European observers?
Maps
A map provides a visual representation of an area showing relationships in space.
Digital Resources
- General Resources
- Topical Maps
- Historical Maps
- Mapping Tools and Interactives
- News
Inquiry Connection: Maps
- Question & Explore - Hummingbirds migrate. What other creatures migrate? Why?
- Assimilate & Infer - Tarantulas are all over the world. They move around but don't migrate.
- Reflect & Share - What's the difference between migration and invasion? Why do some thrive and some die? Fire ants have invaded Missouri!
Organizers
Organizers are effective for showing relationships among data, connections like cause and effect, chronologies of events, and comparisons such as the pros and cons of alternative solutions.
Digital Resources
- Collaborative Concept Mapping
-
Organizer Tools and Interactives from ReadWriteThink
Inquiry Connection: Organizers
- Question & Explore - How can cars by classified? How will my car tree help me understand taxonomy?
- Assimilate & Infer -We’re using the “What Tree Is It”? database to identify and organize the trees in our community.
- Reflect & Share - How will a classification system help me create a world for the Aliens Attack game I want to create?
Images
Digital imaging is the process of creating images from physical objects.
Digital Resources
- National Archives Photo Collections
- Library of Congress Photo Collections
- Resource
Inquiry Connection: Images
- Question & Explore - What was life like in the Klondike of the 1890s?
Read Jason's Gold and The Call of the Wild.
- Assimilate & Infer - Which images best represent these settings?
Use Google Earth and compare to historical photos.
- Reflect & Share - What location will I use for my movie? Select photos.
Symbols
Semiotics is the science of signs and symbols. Symbols are visuals used to represent ideas, concepts, or other abstractions.
Digital Resources
Inquiry Connection: Symbols
- Question & Explore - Why does my school prohibit political symbols?
- Assimilate & Infer - The peace sign is based on the flag signal representing Nuclear Disarmament.
- Reflect & Share - I’m going to make my own peace symbol. I created music to go with my presentation.
SCORE IT!
 How do I get faculty to replace “copy and paste” assignments with “deep thinking” activities?
What types of assignments can I suggest that will be engaging and also address learning needs?
How do I persuade faculty to incorporate graphics?
Examine your assignments and assessments.
Think about how the SCORE IT ideas could be reflected in a project focusing on raising chicks. Go to Chickscope for ideas. Or create your own project starting with Bugscope.
Think about ways students can express understandings with graphics through Storytelling, Communication, Organization, Representation, Evidence, Inference, and Teaching.
Let's explore examples in each category.
Storytelling
 Think about how learning outcomes that support the use of graphics to imagine, invent, tell a story, entertain or display information.
Communication
Think about how learning outcomes that support the use of graphics to explain, define, instruct, report, and communicate.
- Heroes - myhero.com
- Uses the general skills and strategies of the writing process.
- Use Wikimedia Commons for public domain images of people and places
- Nominate a hero through visuals (peacemakers, artists)
- US Constitution - National Constitution Center
- Understands differences and similarities among documents.
- Constitution by Sam Fink - YouTube Videos of Sam Fink - NBC, CNN
- Visualize an important document and make comparisons with classmates.
Organization
Think about how learning outcomes that support the use of graphics to illustrate, navigate, map, chart, diagram, categorize, and classify.
- Cycles
- Understands the structure and function of cells and organisms.
- Interpret illustrations with cycles and create your own.
- Show relationships, cycles, and connections
- Start with one image, the classify and compare others.
- Provide varied images such as Wikimedia Commons - Mitosis
- Identification Keys - What Tree Is That?, Types of Buds
- Knows how organisms are classified into a hierarchy of groups…
- Create a chart for identification or an identification key.
Go to MyWebInspiration and create a concept map. Brainstorm ways this online tool could be used to help young students organize information.
Representation
 Think about how learning outcomes that support the use of graphics to represent, model, depict, and illustrate.
- Chronology
- Understands and knows how to analyze chronological relationships and patterns.
- Create a timeline reflecting your personal history
- Compare the history of a family member with a famous person such as Eleanor Roosevelt
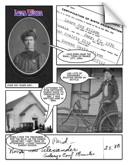
- Expository Writing
- Writes expository compositions.
- Use timelines to tell history on topics such as bicycles.
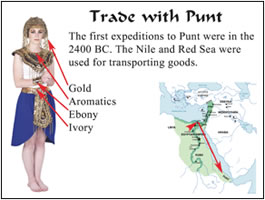
- Ancient Civilizations
- Understands how agrarian societies spread and new states emerging in the third and second millennia BCE.
- Think about history in new ways. Example: Create a Fashion Portfolio focusing on trade and the Nile River.
Evidence
 Think about how learning outcomes that support the use of graphics to document, argue, persuade, and convince.
- History
- Understands the migration and settlement patterns of peoples.
- Use post-it notes to organize evidence.
- Use a Support and Rejects chart to visualize results.
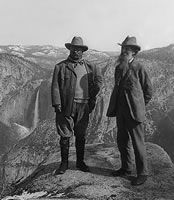
- It All Started...
- Writes persuasive compositions that address problems/solutions.
- Ask student to start with a photo. What impact did these events have on the future? For example, how did Theodore Roosevelt go from game hunter to a protector of the environment? Could it have started with a meeting with John Muir in 1903?
- Lung Disease - Images, Tobacco Ad Database
- Understands the history and trends of health care.
- Use visual evidence to draw conclusions about lung disease and smoking
- Examine Tobacco Ads and watch public service announcements at YouTube: Ad Council
- Create a public service announcement incorporating visual elements.
Inference
Think about how learning outcomes that support the use of graphics to plan, predict, forecast, influence and infer.
- Plants and Seeds
- Understands relationships among organisms and their physical environment.
- Examine photographs, make inferences, and show conclusions. Use graphic tools and photographs to show conclusions.
- Pandemic - Pandemic Flu from CDC
- Understands patterns of crisis and recovery.
- Create a chart comparing an historical pandemic with today or tomorrow.
Teaching
 Think about how learning outcomes that support the use of graphics to model, tutor, guide, review, demonstrate and present.
- Visual Arts
- Understands and applies media techniques and processes.
- Use the digital camera to create photo tutorials showing the process of creating art such as clay pots.
- Spanish
- Presents information, concepts, and ideas to an audience.
- Read Learn Spanish with Superman or other language learning comics
- Use Comic Life to create your own language comic or comic starter.
- Dance
- Identifies and demonstrates movement elements and skills in dance.
- Take digital photos and create a stretching book for a specific audience such as preschoolers or the elderly
- Business Publications
- Uses presentation and multimedia software to design, create, edit, and format presentations and publications.
- Create logos, brochures, and websites for a local non-profit organization
 Geography
- Understands the concept of region. Makes presentations.
- Use Google Earth to explore a region from the sky.
- Create a graphic organizer to teach others about a region.
- World History
- Understands the significance of advancements in tool technology.
- Interview someone who creates tools such as a person doing knapping.
- Create an interactive museum exhibit using PowerPoint.
Learn more at SCORE IT! with Graphic Inquiry, Standards, and Deep Thinking
Focus on Inquiry and Primary Source Documents
Use historical photos to jumpstart inquiry. Focus on making comparisons between then and now using common photos of places such as stores and kitchesn.
Background Information
Technology Tools
| Outside the Book Home | Recipes for Success | Sequential Art & Technology | Get Graphic in the Academic Library |

 Think about how learning outcomes that support the use of graphics to model, tutor, guide, review, demonstrate and present.