 CREATE through Meaningful, Standards-based Products - SCORE IT!
NETS-S 2. Communication and Collaboration
Students use digital media and environments to communicate and work collaboratively, including at a distance, to support individual learning and contribute to the learning of others.
Show students examples of how they can convey ideas in a visual way. Then, provide specific guidelines in terms of the technical and the content requirements.
Let's explore seven graphic-rich ways students can share their understandings including storytelling, communication, organization, representation, evidence, inference, and teaching.
Storytelling
Think about how standards support the use of graphics to imagine, invent, tell a story, entertain or display information.
Start with Photo Prompts for stoytelling.
Examine the Photosynthesis animation. How does the animation help tell the story of photosynthesis? What stories could be told using animation tools to share understandings? Do a search for your topic and add the word "animation".
NETS-S 2a. interact, collaborate, and publish with peers, experts, or others employing a variety of digital environments and media.
Google Earth Outreach is a program that showcases how non-profits and public benefit organizations use Google Earth and Maps to visualize their cause. Our students can find and connect to causes they believe in. For instance, telling the story of lost areas such as lost forests, lost coastlines, and lost mountaintops. Use Google Earth to tell the stories.View an image from National Memorial for the Mountains. Go to the Google Earth project.
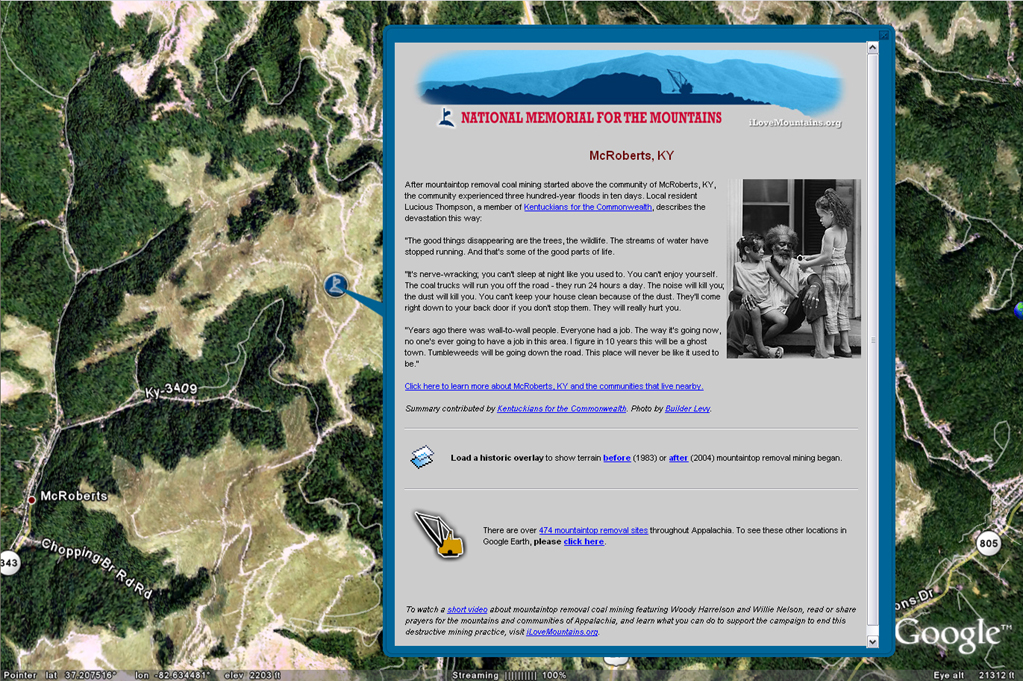
Communication
Think about how standards support the use of graphics to explain, define, instruct, report, and communicate.
NETS-S 2c. develop cultural understanding and global awareness by engaging with learners of other cultures.
Go to the Postcard Geography project and examine the Animals of Utah project.
Organization
Think about how standards support the use of graphics to illustrate, navigate, map, chart, diagram, categorize, and classify.
NETS-S 2d. contribute to project teams to produce original works or solve problems.
An infographic is a wonderful way to share the "big picture" of a topic. Check out "Do students eat like prisoners?"
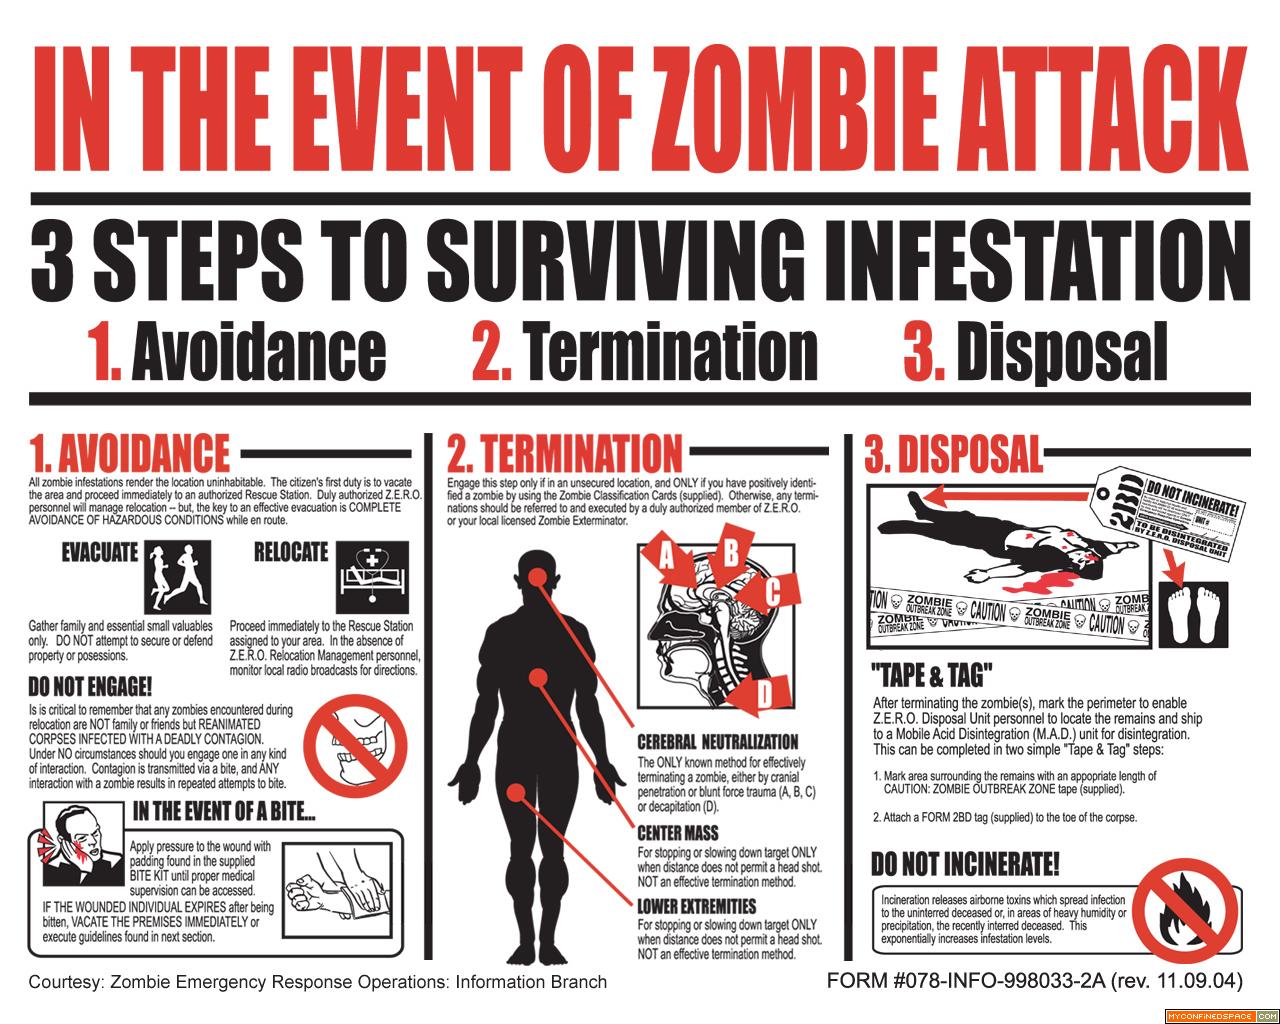
A senior literature class investigating horror literature might enjoy the worlds of weird fiction author HP Lovecraft. Examine the Rules of Survival poster. Examine the Zombie infographic. You can use Zombie infographcs in lots of ways. Do a Google Image Search for Zombie infographic for lots of examples.
Create your own infographic for a real safety or disaster scenario.
It's also a wonderful way for a team to collaborate on a final product. Virtual.ly will soon be providing resources to create infographics. However you can use any graphic tool. Use a tool like Adobe Illustrator.
An infographic is a graphic representation of information. It provides the "big picture" that might otherwise be difficult to understand by using visuals to quickly convey the key ideas.
Learn to make an infographic with an infographic, learn about why infographics are important student projects, and learn about design of infographics and creating your own.
The Learning Network at the New York Times did a nice series on teaching with Infographics:
- Teaching with Infographics: Places to Start
- Teaching with Infographics: Social Studies
- Teaching with Infographics: English
- Teaching with Infographics: Science and Health
- Data Visualized
Explore lots of examples:
- Cool InfoGraphics
- Data Visualization
- Flowing Data
- Gapminder
- Good
- Good Transparency
- Hipmunk Flight Search
- Infographics Showcase
- Joe Lertola
- NMap
- USA Today Snapshots
- Visual Economics
- Visualizing.org
Learn more about using infographic as a creative assessment at Kathy Schock's page.
Ideas for creating infographics:
- Collect and organize information
- Write a descriptive title
- Identify the key ideas
- Put data in a context through a theme, comparisons, or other scheme.
- Visualize data using graphic organizers, charts, tables, etc.
- Think about how you will visualize different types of information
- Maps - locations
- Numbers - charts and graphics, picture charts
- Time - timelines, line chart
- Text - concept map
Visualizations
Representation
Think about how standards support the use of graphics to represent, model, depict, and illustrate.
Examine the Stop-Drop-Roll and Stop-Cover-Drop-Roll posters.
Use tools like Glogster to create your own representations. Explore the "best of glogs" for ideas.
Check out a class Glog on fire safety.
Evidence
Think about how standards support the use of graphics to document, argue, persuade, and convince.
Examine Trees: Inside Out. Talk about how photographs can be used as visual evidence for identification. How can photography be used to examine topics in unique ways through zooming in and out, showing cross sections, showing a series, before/after.
NETS-S 2b. communicate information and ideas effectively to multiple audiences using a variety of media and formats.
Use Historypin to show your local community in the past, predict, and predict the future.
Use iNaturalist.org to share your nature experiences.
Inference
Think about how standards support the use of graphics to plan, predict, forecast, influence and infer.
Use tools like Kwiqpoll to collect data. Compare this to existing data. Then, make predictions.
- Surveymonkey. Easy to use and share.
- Alternatives
- Answergarden. Sign-in optional. Try one at http://answergarden.ch/view/13437
- Flisti. No sign-in required. Try one at http://flisti.com/6989
- Fo.reca.st
- Poll Daddy
- Poll Junkie
- Snap Poll
- Wufoo
- Zizu
- Zoho Polls
Teaching
Think about how standards support the use of graphics to model, tutor, guide, review, demonstrate and present.
Ask students to teach others about the world they can't see through the use of images:
You don't need fancy equipment. The EdTech Toolbox suggests using your iDevice as a camera to record images off a standard microscope.
 Activity 1: Explore an idea under one of the SCORE IT! areas above.
Activity 2: Add ideas and resources to your timeline.