 VISUALIZE through Graphic Tools and Learning Tasks
NETS-S 1. Creativity and Innovation
Students demonstrate creative thinking, construct knowledge, and develop innovative products and processes using technology.
NETS-S 5. Digital Citizenship
Students understand human, cultural, and societal issues related to technology and practice legal and ethical behavior.
Go to the J. Paul Getty Museum educational activities integrating art across the curriculum. Many of the lessons contain image banks and visual resources. Many other sources of image banks are available such as Kitzu.
Let's explore five graphic tools including organizers, maps, images and symbols, diagrams & illustrations, and charts & graphs.
Organizers
Before asking students to create organizers, it's important that they understand how an organizer might be used. Model the use of an organizer with online experiences.
Go to TimeTree. Ask students to make a visual comparison, then write about the comparison.
Do a Google Image Search for "identification key".
Use visual examples to apply and interpret such as the Mineral Identification Key visual.
Use the standard Google Search for keys that are presented through a series of pages and questions. Ask students to create a visual from the key such as Pond Animals, Mineral Identification Key, Macroinvertebrates, Leaf Key, Bird Identification. You can also search for keys by topics such as insect, plant, bird, mineral, rock, tree, and flower such as flower identification key.
Create your own using the SmartArt in Microsoft Word or PowerPoint. Use Exploratree for organizer starters. Or, use an online tool for creating your own from scratch.
Explore tools for creating your own graphic organizers:
- Bubbl.us. Very easy to use. Try it without signing up. No distracting tools, choices, or options.
- Alternatives
- Cacoo. Create diagrams and concept maps.
- Creately. Create diagrams and mindmaps. Try it without signing up.
- Diagrammr. Very easy to show relationships. Try it without signing up.
- Diagramly.
- DropMind. Create mindmaps. Must sign up.
- Gliffy. Works great, but very annoying signup reminders. Try it without signing up.
- Lovelycharts. Create charts. Must sign up.
- Lucidchart. Create a flowchart or concept map. Try it without signing up.
- Mindmeister. Create a concept map. Must signup.
- Mindomo. Create a mindmap. Must signup. Three maps for free.
- mind42. Create mindmaps with links. Must signup.
- Popplet. Creat concept maps and post-its. Must signup.
- Slatebox. Creat mindmaps. Must signup.
- Spicynodes. More an a mindmap. Includes lots of space for text, links, images, etc. Try it without signing up.
- SpiderScribe. Create maps and include notes, documents, images, etc.
- Text2Mindmap.
- Venn from ReadWriteThink
Go to A Periodic Table of Visualization Methods. Explore the many different ways that you and your students can visualize information.
 Activity 1: Use a Google search to explore identification keys.
Activity 2: Explore the A Periodic Table of Visualization Methods. Pick three and share with a neighbor.
Maps
NETS-S 1a. apply existing knowledge to generate new ideas, products, or processes.
Take a traditional activity and make it exciting through the use of technology. For instance, read books set in Europe and use Google Maps to explore the settings. For instance, FLIP by Martyn Bedford is set in the United Kingdom. Student could create book trailers and place them on the map such as the FLIP book trailer.
Go to Novelsonlocation. The pins represent books that take place at those locations. This type of activity could be done with books in a particular state, books about a time period such as World War II, or other topics. Google Maps is used for this project.
Go to Google LitTrips to extend the idea to include trips associated with books.
 NETS-S 5c. demonstrate personal responsibility for lifelong learning.
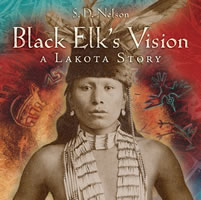
Encourage students to learn more about the settings of any book they are reading. Now and in the future. Model the idea of expanding the learning experience through the use of maps and other visuals. When reading a book like Black Elk's Vision by S.D. Nelson, show the timeline in the book. Find the locations on the map. Talk about the distances.
Explore tools for creating your own maps:
- Google Mapmaker
- MyGreatMaps and MapMaker 2.0. Perfect for elementary and middle schools.
- National Geographic MapMaker Interactive
- National Altas Mapmaker
- Old World Map Maker. Great for elementary school. Create an "old world" map.
Activity 1: Explore Novelsonlocation or Google LitTrips.
Activity 2: Compare tools for creating your own maps.
Images & Symbols
NETS-S 1b. create original works as a means of personal or group expression.
Learn about the history of the alphabet through a visual. Creating fonts is a great way to create a personal means of expression. Go to Fontstruct to see examples. Then, create an account and use their tools to create your own original font!
It's useful to begin with exploration, before creating your own. Go to the 360cities, Google Panaramo, Gigapan, and Photosynth site. Explore the inside of a Submarine. Examine the Sistine Chapel. Check out the New 7 Wonders and View Your World. Think about a tour you could build.
Use the Hugin Opensource to create Panoramas.
Explore Stereograph website and create your own. Learn about the location.
NETS-S 5b. exhibit a positive attitude toward using technology that supports collaboration, learning, and productivity.
Photo projects don't need to be complex. Check out the Math Trail photo project.
Simple tools encourage success and sharing. Focus on creating simple products such as photographs, collages, cards, or memory boxes. Ask students to create a project, then write about the elements they selected.
- Photo Flex. Easy to use photo editor.
- Alternatives
- Aviary. Provides a great web widget to embed on your website.
- Befunky. Photo editing tools.
- BigHugeLabs. Lots of fun activities like making magazine covers and posters.
- Dumpr. Lots of fun filters.
- ImageChef. Lots of options.
- Kerpoof. Very easy to use Make a Drawing feature.
- Kizoa. Online photo editing.
- Flipbook. Make a flipbook by drawing pictures.
- Pho.to. Photo editing. Fun shapes and additions.
- PicFull.
- RedKid Science Generator.
- Rsizr. Great for simple resizing activities.
- SumoPaint. Easy, quick drawing tool with no sign-in.
- Tuxpi. Photo editing.
Explore tools for creating your own images and symbols:
- Cardmaker
- LogoMaker
- Totem Pole Creator
- US Bill Generator
- Habitat Maker
- Insect Generator
- Mammal Maker
Activity 1: Explore Google Panaramo, 360cities or Gigapan. Design an activity involving student use of cameras.
Activity 2: Create a sample project using the tools provided.
Activity 3: Try Apple Photobooth.
Diagrams and Illustrations
NETS-S 1c. use models and simulations to explore complex systems and issues.
Use interactive diagrams to explore concepts.
- Examine human body models such as BioDigitalHuman or Zygotebody.
- Use science interactives such as FreezeRay Science.
- Analyze games such as Nobel Prize educational games.
- Explore interactive diagrams such as neoK12: diagram.
Take screen shots when using interactives. Write about the game or use of the tool.
NETS-S 5a. advocate and practice safe, legal, and responsible use of information and technology.
Read the article Political Cartoons in America.
Before creating your own illustrations in class, examine existing resources. Start at Cartoons for th Classroom. They provide lots of teaching ideas. For more lessons go to Opper Project.
Talk about copyright, fair use, and issues in the use of political cartoons. Discuss copying versus linking to a website.
- Current Cartoons
- Historical Cartoons
Explore tools for creating your own diagrams and illustration:
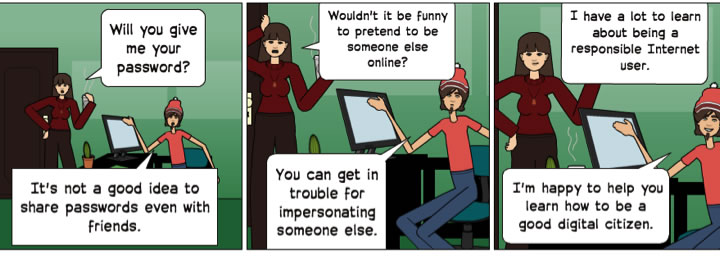
- Pixton. Use the free version or consider the school version. Check out the Digital Citizen example.
- Alternatives
- Bitstrips. Need to sign-in to save.
- Bubblr
- Cartoonist from Creaza
- Chogger
- Comic Creator
- Comic Master
- Comic Strip Maker. Easy for younger students.
- Comix
- Lego City. Great for younger students.
- KABAM. Restricted to the story and theme provided.
- MakeBeliefs Comix. You can print or email your comic. No storage.
- Myths and Legends
- Professor Garfield. Provides characters for stories.
- Scholastic
- Bone Comic Creator.
- Captain Underpants
- Charlotte's Web Comic Creator. Easy for younger students.
- Smile Comic Creator
- Strip Generator. Sign-in required to save and publish. Print without sign-in.
- Superhero Squad Show
- Superlame
- ToonDoo
- Toonlet
- Witty Comics
NETS-S 5d. exhibit leadership for digital citizenship.
Ask students to create a comic on the topic of digital citizenship dealing with an important teen issue such as texting and driving, privacy, use of passwords, social networks, copyright, etc.
Activity 1: Explore interactives, take screen shots, paste into Word or PowerPoint, and write about the image.
Activity 2: Explore comics. Create a comic.
Charts & Graphics
NETS-S 1d. identify trends and forecast possibilities.
Go to Public Data Explorer.
Use existing data to create a chart, graph, or map.
- BetterWorldFlux.
- Data360.
- DebateGraphic.
- Gapminder.
- Regional Explorer.
- World Bank Data.
- Worldmapper.
Explore tools for creating your own charts and graphs:
- Create a Graph
- Alternatives
- ChartGo
- ChartTool
- ChartTool from Google
- Cool Graphing. Great for elementary.
- Graph Master. Great for Elementary.
- Pie Creator
Activity 1: Explore data sites. Design an assignment.
Activity 2: Compare two graphing tools.