The Scientific Method and Inquiry
 The basic definition of the Scientific Method includes these steps:
- observation and description of a phenomenon
- formulation of a hypothesis to explain the phenomena
- use of the hypothesis to predict existence of other phenomena
- performance of experimental tests of the prediction and inferring a conclusion
- some include a fifth step of presenting, debating and/or application of findings
Questioning
The inquiry process gives heavy emphasis to development of questions at each step.
- What questions come from observation?
- What questions are relevant to the hypothesis?
- What questions formulate the prediction?
- What questions are answered from the test of the prediction and what questions, new and old, remain unanswered in part or in full?
The process of Information Inquiry involves application of the ancient Socratic Method of teaching through self-posed and mentor-posed questions in order to gain meaning in today’s overwhelming Information Age. Further application of the Scientific Method gives a systematic structure to this process. It places students and teachers in the role of Information Scientists. This analogy will be explored as one that may open new paths for students and teachers to investigate not only phenomenon identified from typical subjects of study, but to also test and predict the value, relevance and meaning of information itself. As “information scientists” should the learner be expected to journal, debate, compare, and present his or her observations on the value of the information encountered and the need for information that may not be available or possible to obtain?
 Student Information Scientists on a Farm
After visiting an area farm, students became fascinated with how farmers grow and sell their crops. How do they decide what to grow? Why do they rotate crops? When do they plant? How do they decide when to sell? What factors impact the price of crops?
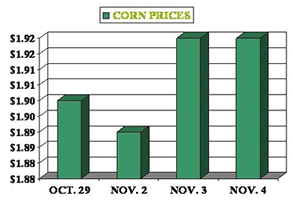
One student information scientist traced the Chicago Board of Trade corn prices over a week and graphed the results. See the graphics below: one in marker and the other computer-generated.


