
Text Techniques
Many techniques can be used to help students generate, organize, and transform their ideas through written language.
Generation
Brainstorming. The process of recording many ideas related to a particular problem or other is called brainstorming. All thoughts are listed no matter how strange they may seem. When all ideas have been exhausted, then the list is organized and evaluated. Although often done in groups, brainstorming can also be done individually.
SCAMPER. The SCAMPER technique is used for generating ideas. List the following words in a list or as a visual map: Substitute, Combine, Adapt?, Modify/disort?, Put to other use? Eliminate? Rearrange? (SCAMPER)
Organization
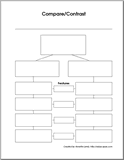
Compare/Contrast Chart. How is the information from different resources alike and different? Why? Compare and contrast sources and types of information. Identify new pieces of information that can be added to overall understanding. Use a three-column comparison chart to help organize and analyze information on topics where there are two or more perspectives. For example, you might compare and contrast two views on public smoking. Or, you could compare fur and anti-fur industry perspectives.
Click the Compare/Contrast chart below to download the full-sized PDF file.
Glossary. A word list with definitions is useful for students who are likely to encounter new vocabulary in their exploration. It's also help for students to generate their own glossary or pictionary as part of the inquiry process.
Inductive Tower. An inductive tower is used to develop an effective, logical argument based on foundation of evidence. Students build inference from a collection of evidence.
Click to see an example of an Inductive Tower on the topic of Global Warming and Polar Ice Caps.
Matrix. An arrangement of information in a rectangular array of entries set out in rows and columns is effective with small amounts of data that area easily organized by elements or features. A matrix is useful when examining similarities and differences among information or categorizing information.
 Note-taking. Note-taking is common way of keeping track of information found in sources.
- NoteStar - web-based note-taking generator
Students may take notes independently or the instructional media specialist may provide guiding questions. Another approach is for the class or team to brainstorm questions as a group that are used for note-taking activities.
Click the visual on the right to see a child's research notes related to exploring American Indian Tribes. Click the close box to return to this page.
Outlining. In designing a report or other piece of linear writing, outlining can be an effective organizational tool.
PMI. The PMI model starts with a question and an open mind. Write the question at the top of a piece of paper. Create three columns with the headings "P", "M", and I. In column "P" write for 2 minutes the positive points you can think of regardless of whether you agree or disagree. Then spend 2 minutes writing minus points in column "M". Finally, spend 2 minutes writing all the interesting points that relate to the topic. Study the results. (Edward deBono)
Click on the visual below to enlarge a variation of the PMI model. Close the window when done.

Timeline. A chronological record of events is helpful in establishing order and making comparisons. This tool is useful whenever students are trying to make sense of a number of possibly related events. Teachers may provide timelines that can be used for comparisons or students may build them from scratch as they gather information.
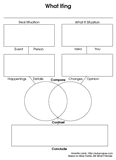
What If Chart. The What ifing Chart asks students to describe the "real situation" including the event and people. Then, describe the "what if situation" including the new idea and your role. Finally compare and contrast these two ideas on a Venn diagram and draw a conclusion. For example, what would happen if UFOs landed? What would happen if we eliminated the current welfare system? What would happen if we tried an alternative form of punishment for particular crimes? Click the What Ifing chart below to download the full-sized PDF file.
Weighted Sum Chart. Create a spreadsheet matrix adding elements to rows and columns. Assign weights based on criteria.
Transformation and Creation
Simile. Abstract comparisons can be represented in similes. Students are asked to describe how one thing or idea is like another. Teachers may begin by using similes to identify student prior knowledge about a topic. As students gain experience they may use similes in their writing. (Thompson, Licklider, and Jungst)
Communication
Report
Other Ideas
- brainstorms
- highlighting
- mnemonic devices
- notetaking
- outlining
- summarizing